Top 3 Price Prediction: Bitcoin, Ethereum, Ripple – BTC, ETH and XRP eye breakout for fresh recovery
- Bitcoin price is nearing the descending trendline on Monday, breakout close above suggests a recovery ahead.
- Ethereum approaches its key resistance level at $3,017, a firm close could open the door for upside.
- XRP faces resistance around the $1.96 daily level, sustained break above it would confirm renewed bullish momentum.

Bitcoin (BTC), Ethereum (ETH), and Ripple (XRP) are approaching key technical levels at the time of writing on Monday as the broader crypto market stabilizes. Market participants are closely watching whether BTC, ETH, and XRP can sustain breakouts and achieve decisive daily closes above nearby resistance levels, which could signal the start of a short-term recovery.
Bitcoin could recover if it closes above key resistance
Bitcoin price was retested and found support at the 78.60% Fibonacci retracement level at $85,869 on Thursday, and it recovered 3.67% over the next three days. As of Monday, BTC is approaching the descending trendline (drawn by connecting multiple highs since October 6).
If BTC breaks above the declining trendline and closes above the $90,000, it could extend the recovery toward the next resistance at $94,253.
The Relative Strength Index (RSI) reads 45, pointing upward toward the neutral level of 50, indicating early signs of fading bearish momentum. For the bullish momentum to be sustained, the RSI must move above the neutral level. Moreover, the Moving Average Convergence Divergence (MACD) indicator showed a bullish crossover on Saturday, further supporting the recovery thesis.
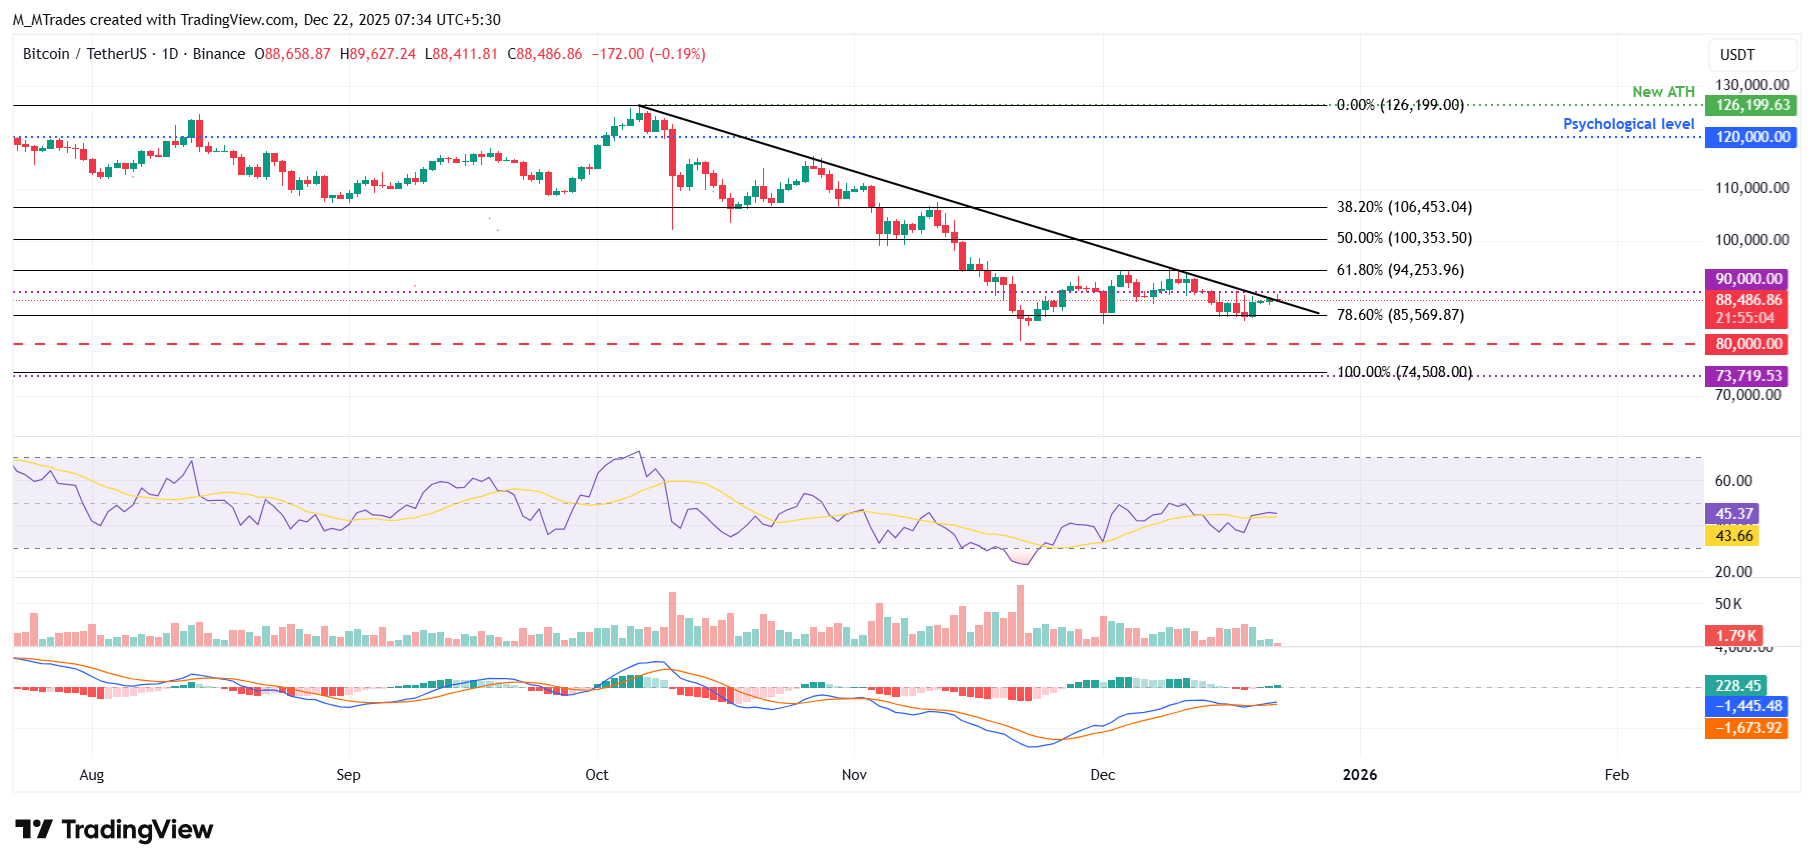
On the other hand, if BTC faces a correction, it could extend the decline toward the key support at $85,569.
Ethereum nears key resistance level
Ethereum price was retested on Thursday and found support around the descending trendline, and it recovered nearly 6% over the next three days. As of Monday, ETH is approaching the daily resistance level at $3,017.
If ETH closes above $3,017 on a daily basis, it could extend the recovery toward the December 10 high at $3,447.
The RSI reads 47, pointing upward toward the neutral level of 50, indicating early signs of fading bearish momentum. For the bullish momentum to be sustained, the RSI must move above the neutral level. Moreover, the Moving Average Convergence Divergence (MACD) lines are converging, and a flip to a bullish crossover would further support the bullish outlook.
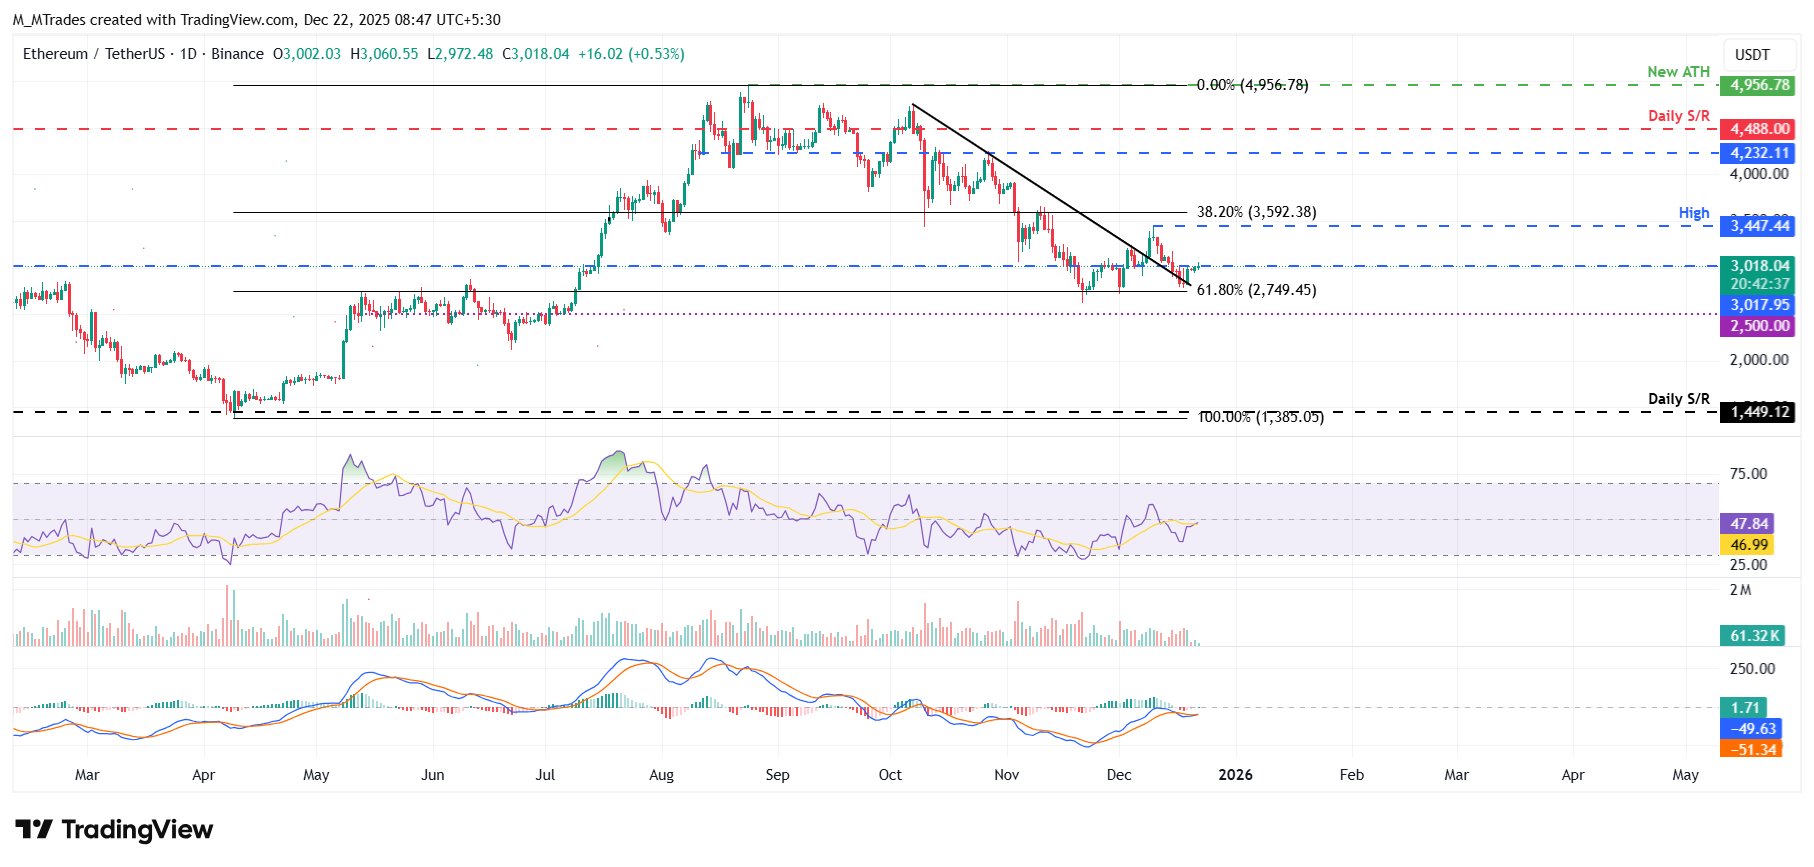
On the other hand, if ETH is rejected, it could extend the decline toward the key support at $2,749.
XRP could recover if it closes above $1.96
XRP was retested and found support around the lower trendline boundary of a falling wedge pattern on Friday, and recovered slightly the next day. As of Monday, XRP is approaching the daily resistance at $1.96.
If XRP closes above the daily resistance at $1.96 on a daily basis, it could extend the recovery toward the 50-day EMA at $2.13.
The RSI on the daily chart reads 42 below its neutral level of 50, indicating bearish momentum. The Moving Average Convergence Divergence (MACD) is showing a bullish crossover on Monday, indicating early signs of bullish momentum.
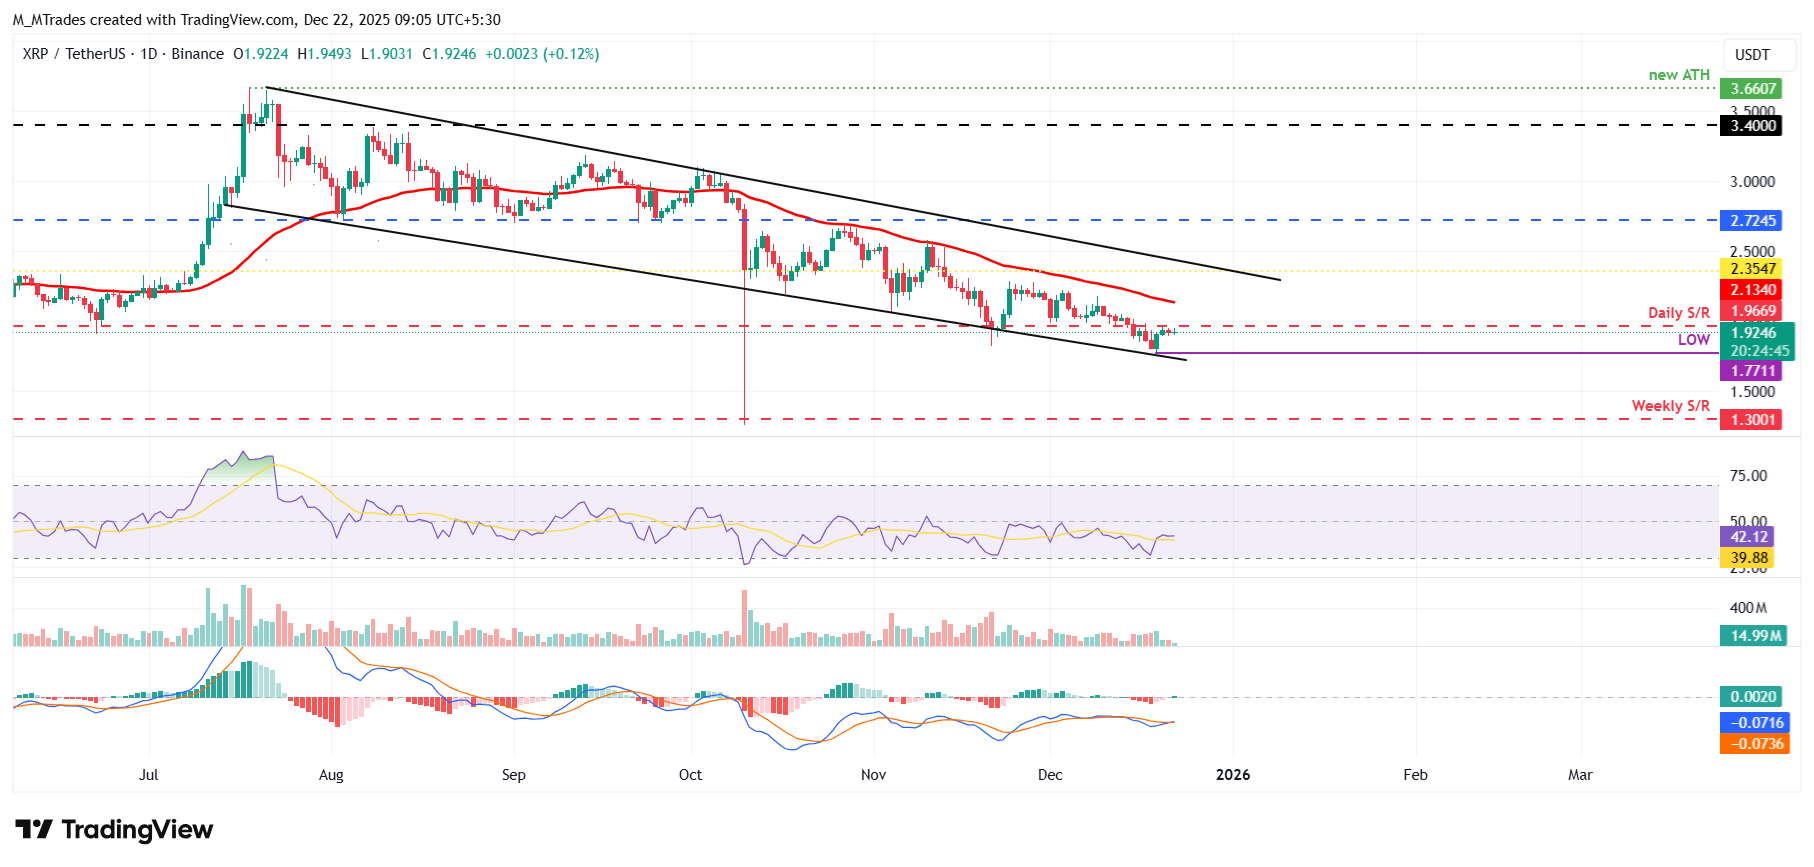
However, if XRP faces a correction, it could extend the decline toward Friday’s low of $1.77.
Cryptocurrency metrics FAQs
The developer or creator of each cryptocurrency decides on the total number of tokens that can be minted or issued. Only a certain number of these assets can be minted by mining, staking or other mechanisms. This is defined by the algorithm of the underlying blockchain technology. On the other hand, circulating supply can also be decreased via actions such as burning tokens, or mistakenly sending assets to addresses of other incompatible blockchains.
Market capitalization is the result of multiplying the circulating supply of a certain asset by the asset’s current market value.
Trading volume refers to the total number of tokens for a specific asset that has been transacted or exchanged between buyers and sellers within set trading hours, for example, 24 hours. It is used to gauge market sentiment, this metric combines all volumes on centralized exchanges and decentralized exchanges. Increasing trading volume often denotes the demand for a certain asset as more people are buying and selling the cryptocurrency.
Funding rates are a concept designed to encourage traders to take positions and ensure perpetual contract prices match spot markets. It defines a mechanism by exchanges to ensure that future prices and index prices periodic payments regularly converge. When the funding rate is positive, the price of the perpetual contract is higher than the mark price. This means traders who are bullish and have opened long positions pay traders who are in short positions. On the other hand, a negative funding rate means perpetual prices are below the mark price, and hence traders with short positions pay traders who have opened long positions.
Author

Manish Chhetri
FXStreet
Manish Chhetri is a crypto specialist with over four years of experience in the cryptocurrency industry.




