Tezos Price Prediction: XTZ’s imminent pullback could lead to a 40% breakout
- Tezos price has been consolidating in a symmetrical triangle pattern for almost a month.
- XTZ could drop 12% due to Tom DeMark Sequential indicator’s sell signal.
- Completion of this technical formation forecasts a 40% breakout.

Tezos price could see a small pullback after hitting a ceiling in a symmetrical triangle pattern. Coercing this correction is another indicator’s sell signal, which makes the drop compelling.
Tezos price hits a roadblock
Tezos price has been forming lower highs ever since it hit a local top of $5.64 on February 14 due to aggressive sellers. However, buyers responded with an equal force, creating higher lows. A symmetrical triangle pattern forms by connecting the swing highs and the swing lows using trendlines.
This setup’s target is identified by measuring the distance between the pivot high and pivot low and adding it to the breakout point. Since this pattern has no inherent bias, the direction of the breakout could go either way.
Now, Tezos price seems to have hit a blockade around the $4.58 level due to the presence of the declining trendline acting as resistance and the SuperTrend indicator’s sell signal. Favoring a pullback is the Tom DeMark sequential indicator, which forecasted a one-to-four candlestick correction after a sell signal in the form of a green nine candlestick was formed on the 12-hour chart.
Due to such a strong confluence of multiple technical aspects, Tezos price seems to be ready for a 12% correction towards the triangle’s lower trendline around $3.73. Things get particularly interesting around this level. A prolonged selling pressure leading to a 12-hour candlestick close below this point could trigger a steep 40% correction to $2.18.
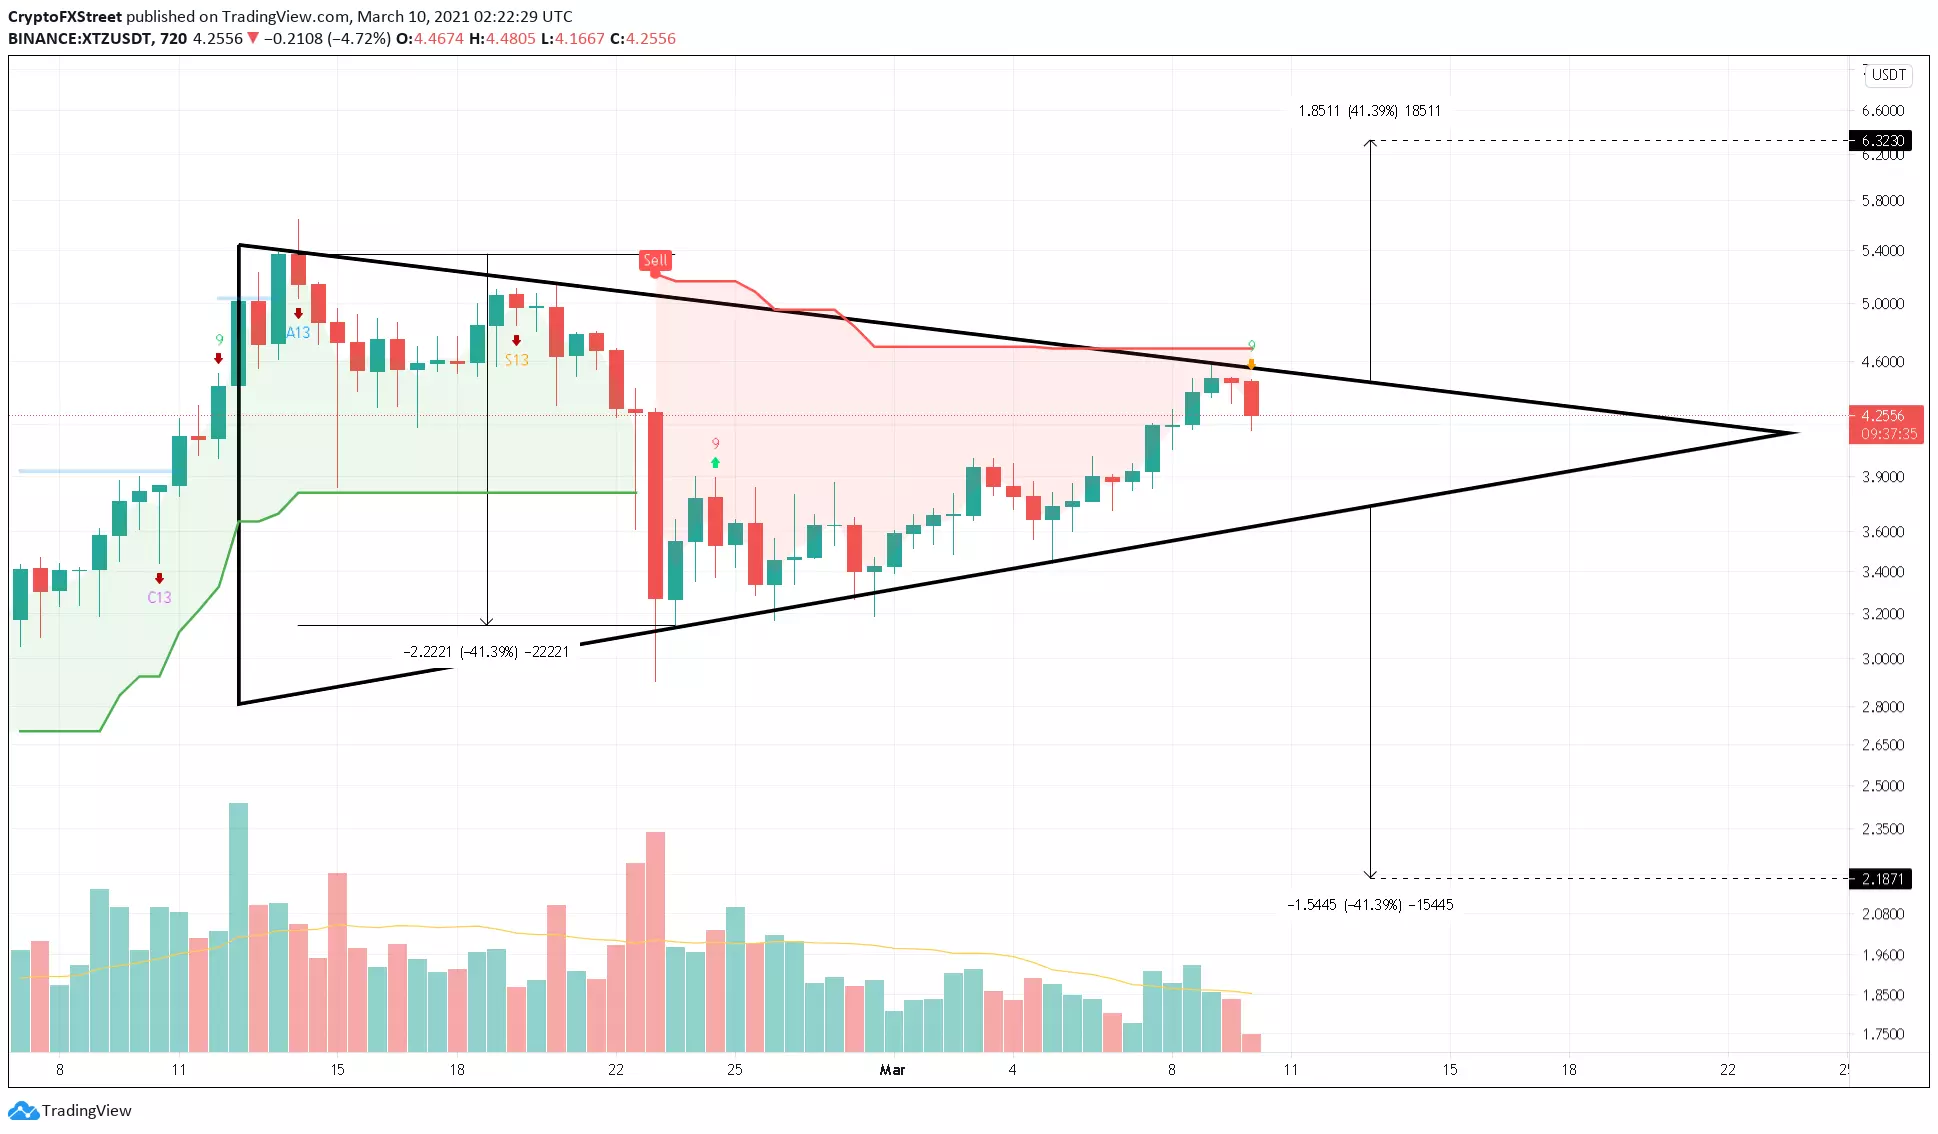
XTZ/USDT 12-hour chart
While the above seems exceptionally bearish, investors need to note that a bounce around the $3.73 level could result in an upswing in Tezos price towards the symmetrical triangle’s upper trendline at $4.47. If buyers band together, leading to a decisive 12-hour candlestick close above technical formation’s upper trendline, then a 40% bull rally to $6.32 can be contemplated.
Author

Akash Girimath
FXStreet
Akash Girimath is a Mechanical Engineer interested in the chaos of the financial markets. Trying to make sense of this convoluted yet fascinating space, he switched his engineering job to become a crypto reporter and analyst.



