Terra Luna Price Forecast: Key levels to watch, as LUNA remains borderline overbought
- Terra Luna price is bullish, but this position is under threat with the RSI indicator almost confirming a sell signal.
- LUNA could fall 10% to the 50-day EMA at $0.4537, or complete a 30% slide to the $0.3859 support floor.
- Invalidation of the overbought outlook will occur upon a break and close above $0.5617. Uptrend confirmation above $0.6562
- Key levels to watch include $0.5617 and $0.6562, the mean threshold and consequential encroachment of two respective zones.

Terra Luna (LUNA) price exploded on September 27, extrapolating the gains that had been made beginning last weekend. The move is part of an attempted recovery rally, but the current outlook shows that bulls may have taken a breather, perhaps to regroup before the next move.
Also Read: Terra Classic price up 14% in a week – What’s next for LUNC? Two other penny cryptos to watch
Terra Luna price shoots 55%, are bulls regrouping?
Terra Luna (LUNA) price surged 55% between Saturday September 23 and Thursday September 28, when it recorded an intra-day high of $0.5980. The move saw LUNA flip the 50-day Exponential Moving Average (EMA) from a resistance to a support level at $0.4539. Interestingly, it also saw LUNA breach the 100-day EMA, located at a crucial level, the midline of an order block representing the supply zone, before pulling back.
At the time of writing, Terra Luna price is $0.5183, countered by aggressive selling from the supply zone, at $0.5463. The rejection from the midline of this order block, otherwise termed mean threshold at $0.5617, has sent LUNA down 15% to the current price of $0.5182.
Meanwhile, the Relative Strength Index (RSI) has just crossed below 70 to the downside, hinting that LUNA could be ripe for selling. This will be confirmed if it records a solid extension south, possibly hitting 67. For the meantime, the RSI signal is pending confirmation, and Terra Luna price could still extend north.
Meanwhile, the presence of a fair value gap (FVG) at $0.6276 acts as a magnet for Terra Luna price, drawing it higher to fill the inefficiency residing between $0.6276 and $0.6606. These are the intraday high and low of the July 25 and July 23 trading sessions respectively.
The histogram bars of the Awesome Oscillator (AO) support the bullish outlook, flashing green while holding forte in the positive zone. This shows bullish momentum to drive the price higher.
Key levels to watch are the mean threshold (MT) and the consequential encroachment CE). For a short-term uptrend, Terra Luna price must break and close above the mean threshold at $0.5617, quelling uncertainty of whether LUNA is overbought.
In the longer term, a decisive move above the consequential encroachment at $0.6452 would confirm the uptrend, confirming the uptrend and sending Terra Luna price towards $0.7424, levels last seen on June 10.
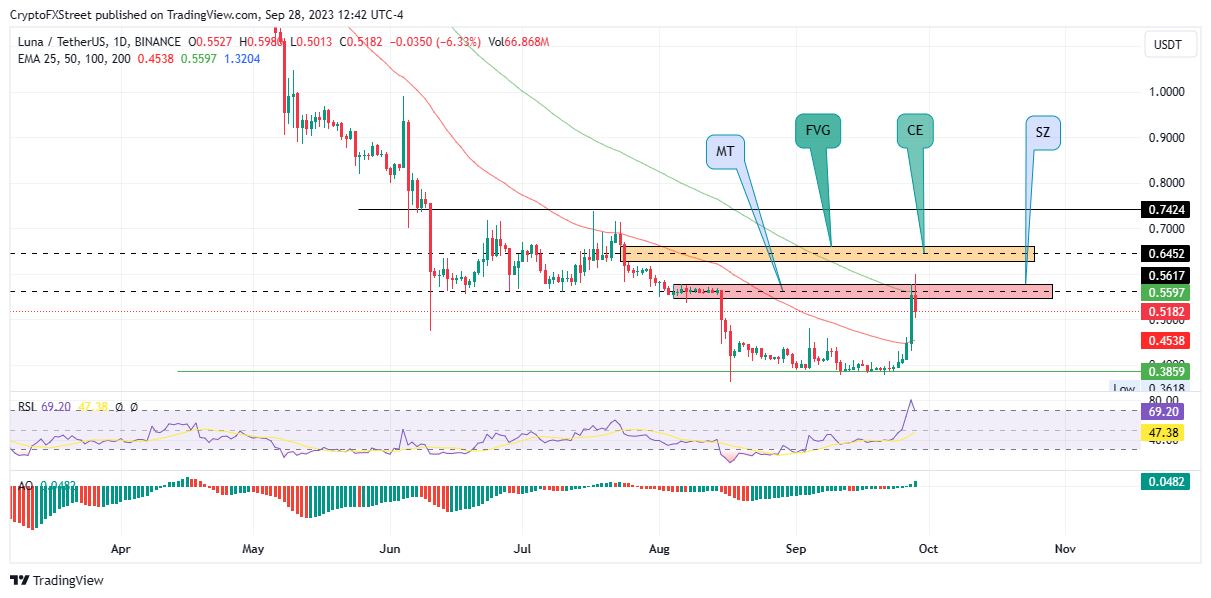
LUNA/USDT 1-day chart
If the supply zone holds as a resistance level, the ensuing selling pressure could send Terra Luna price south, potentially losing the support offered by the 50-day EMA at $0.4538. In the dire case, the downtrend could deliver LUNA to the support floor at $0.3859. This would denote a 35% fall from current levels.
Cryptocurrency metrics FAQs
What is circulating supply?
The developer or creator of each cryptocurrency decides on the total number of tokens that can be minted or issued. Only a certain number of these assets can be minted by mining, staking or other mechanisms. This is defined by the algorithm of the underlying blockchain technology. Since its inception, a total of 19,445,656 BTCs have been mined, which is the circulating supply of Bitcoin. On the other hand, circulating supply can also be decreased via actions such as burning tokens, or mistakenly sending assets to addresses of other incompatible blockchains.
What is market capitalization?
Market capitalization is the result of multiplying the circulating supply of a certain asset by the asset’s current market value. For Bitcoin, the market capitalization at the beginning of August 2023 is above $570 billion, which is the result of the more than 19 million BTC in circulation multiplied by the Bitcoin price around $29,600.
What is trading volume?
Trading volume refers to the total number of tokens for a specific asset that has been transacted or exchanged between buyers and sellers within set trading hours, for example, 24 hours. It is used to gauge market sentiment, this metric combines all volumes on centralized exchanges and decentralized exchanges. Increasing trading volume often denotes the demand for a certain asset as more people are buying and selling the cryptocurrency.
What is funding rate?
Funding rates are a concept designed to encourage traders to take positions and ensure perpetual contract prices match spot markets. It defines a mechanism by exchanges to ensure that future prices and index prices periodic payments regularly converge. When the funding rate is positive, the price of the perpetual contract is higher than the mark price. This means traders who are bullish and have opened long positions pay traders who are in short positions. On the other hand, a negative funding rate means perpetual prices are below the mark price, and hence traders with short positions pay traders who have opened long positions.
Author

Lockridge Okoth
FXStreet
Lockridge is a believer in the transformative power of crypto and the blockchain industry.


