Synthetix Network Price Analysis: SNX drops after rejection at critical level
- Synthetix forms the bearish engulfing pattern suggesting a further downturn.
- SNX dropped after encountering massive resistance at the 200-day SMA.

Synthetix Network had dropped from $4.63 to $2.58 between October 22 to November 3. The bulls then managed a comeback and took the price up to $4.67on November 10. Since then, several technicals have turned bearish, which suggests a drop in price.
SNX going down hard?
Synthetix encountered massive resistance at the 200-day SMA ($4.68) and dropped to $4.19. While the MACD shows that the current market momentum is bullish, the two latest candlesticks have formed a bearish engulfing pattern. This suggests that the price is going to go down some more.
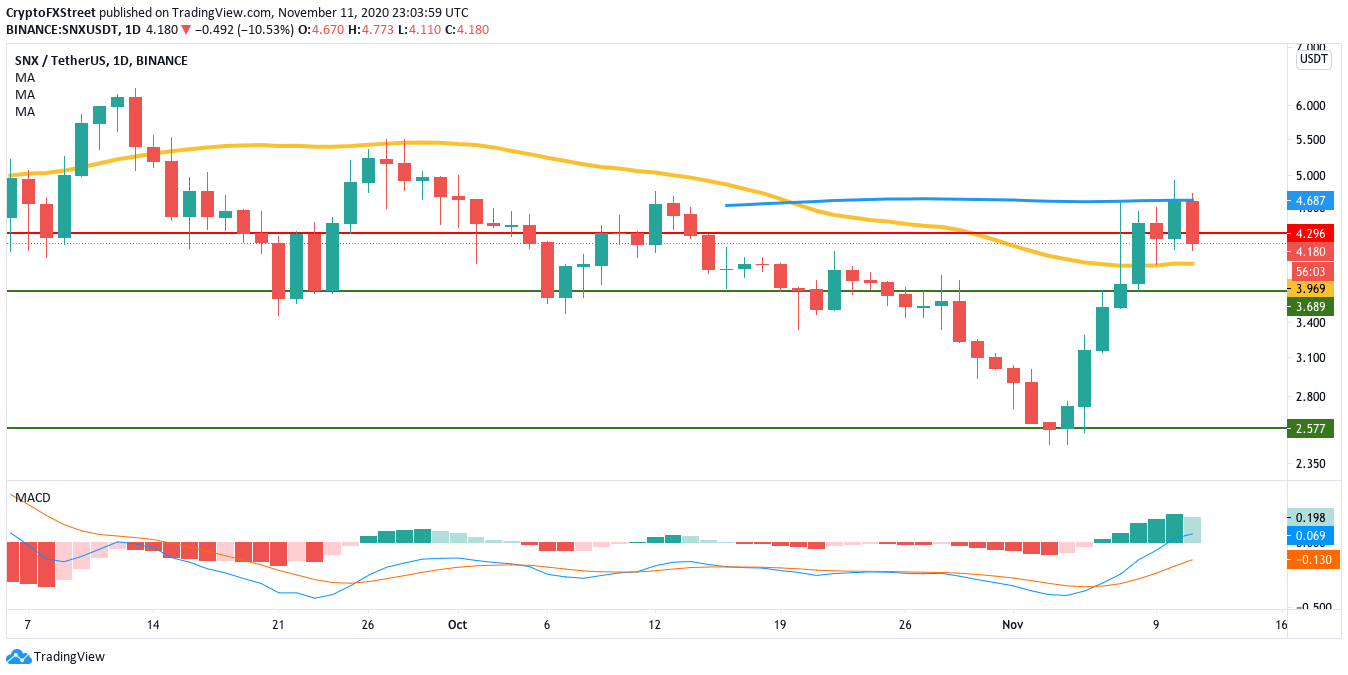
SNX/USDT daily chart
IntoTheBlock’s In/Out of the Money Around Price (IOMAP) shows moderate support at the 50-day SMA ($3.97). It may not be strong enough to absorb a lot of selling pressure. Beyond that, there is a stronger support wall at $3.69, wherein 789 addresses had previously purchased 3.37 million tokens. If the bears manage to break below this level, they could potentially take down the price to the $2.58 support wall.
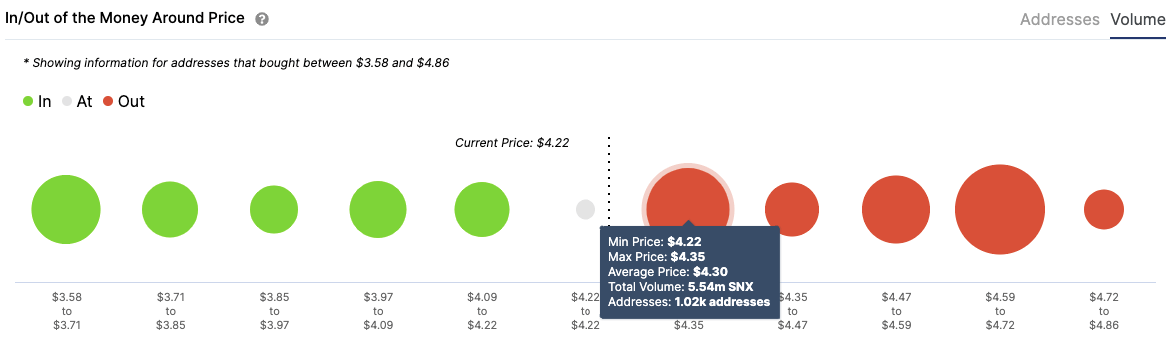
SNX IOMAP
However, while the picture looks pretty gloomy for SNX, there is hope for the buyers. The number of new addresses entering the network daily has reached 358, the highest over the last month. This shows that the network is growing, which is a very positive sign.
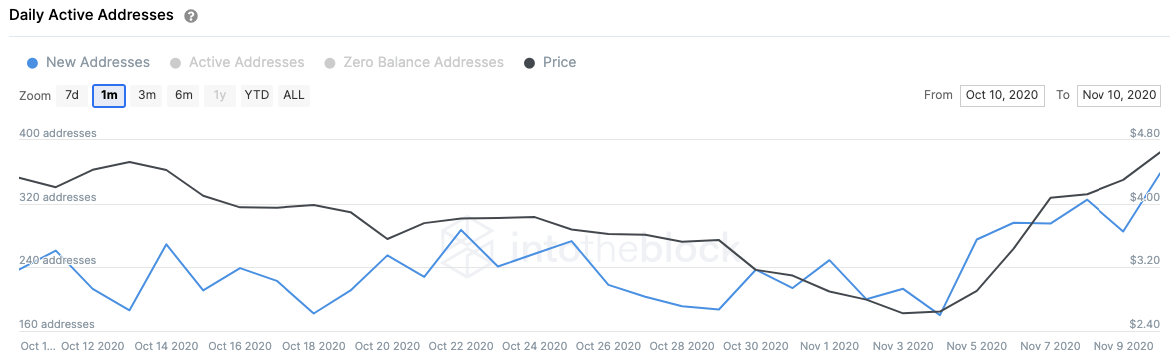
SNX new addresses
During the downturn, the bears managed to flip the $4.30 line from support to resistance. So even if the buyers somehow take control, their upside is severely limited at this barrier. The bears, on the other hand, don’t face any strong support walls. If they break below the $3.69 support, they could potentially take the price down to $2.58.
Author

Rajarshi Mitra
Independent Analyst
Rajarshi entered the blockchain space in 2016. He is a blockchain researcher who has worked for Blockgeeks and has done research work for several ICOs. He gets regularly invited to give talks on the blockchain technology and cryptocurrencies.


