Sui surges to new all-time high amid Phantom wallet integration, strong on-chain metrics
- Sui price is rallying on Friday for a second straight day, reaching a new all-time high of $4.49 after increasing more than 20% so far this week.
- The rally was fueled by the announcement that Phantom Wallet integration with the Sui blockchain led to record-breaking on-chain metrics.
- The technical outlook suggests a continuation of the rally, targeting a new all-time high of $5.68.
Sui (SUI) extends its gains on Friday, reaching a new all-time high (ATH) of $4.49 and surging more than 23% so far this week. The main reason behind the rally is Thursday's announcement that Phantom Wallet will integrate with the Sui blockchain.
Another factor favoring Sui’s bullish outlook is its record-high levels seen in daily trading volume, Total Value Locked (TVL) and Open Interest (OI) in the Sui network. The technical outlook suggests a continuation of the rally, pointing to a potential new all-time high of $5.68.
Why is SUI going up today?
Sui price trades 2.2% higher, reaching a new ATH of $4.49 on Friday. The main reason for the recent price surge was Thursday's announcement of Phantom Wallet integration with the Sui blockchain, which led to a sharp 15% daily increase.
This integration enhances Sui’s usability, allowing users to access features like staking, token swaps, and NFT storage, thereby increasing its appeal and user base.
BREAKING NEWS @Phantom is coming to the Sui ecosystem!
— Sui (@SuiNetwork) December 5, 2024
One wallet. Endless possibilities. Intuitive multichain features. ✨
From native bridges to seamless asset swaps, you’ll soon be able to explore everything Sui has to offer with the wallet trusted by millions.… pic.twitter.com/8jnDAgJUns
Technical outlook: Sui uptrend likely to continue
Sui price reached a new ATH of $4.49 on Friday after breaking its previous ATH of $3.93 on Thursday.
If SUI continues the upward trend, it could extend the rally to test $5.68, the 141.40% Fibonacci extension level drawn from the October 28 low of $1.59 to Friday’s high of $4.49.
The Relative Strength Index (RSI) on the daily chart reads 76, trading above its overbought level of 70. Traders should be cautious when adding to their long positions because the chances of a price pullback are increasing. Still, the RSI is stable, so there is the possibility that the rally continues and the indicator remains above the overbought level. A clear sell signal would occur if the RSI exited overbought territory.
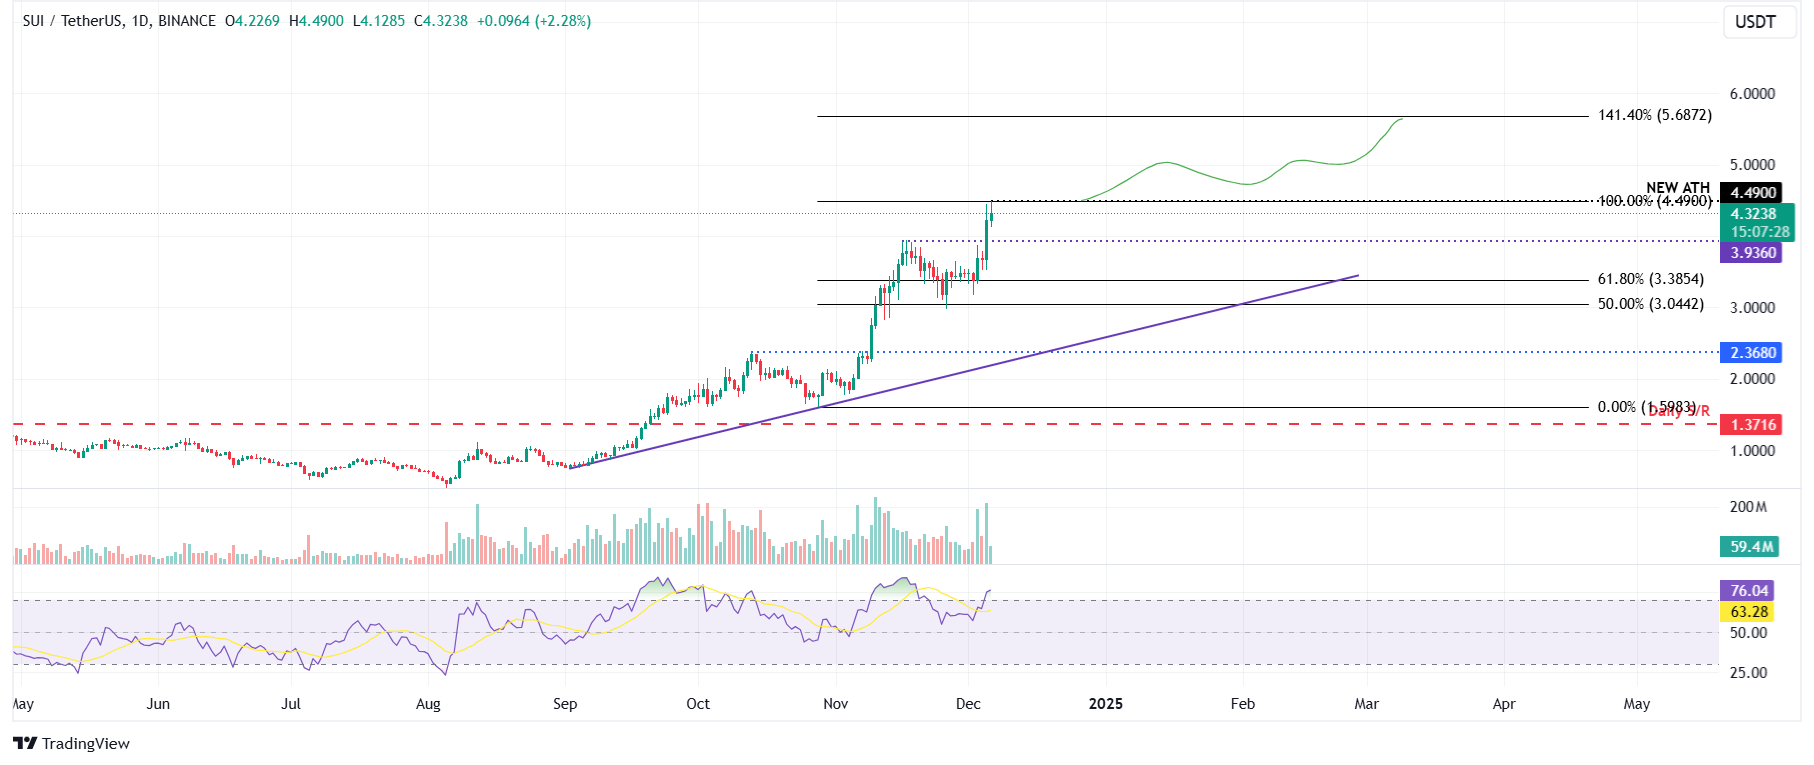
SUI/USDT daily chart
SUI’s on-chain metrics support bullish outlook
Data from crypto intelligence tracker Santiment data shows a recent surge in traders’ interest and liquidity in the SUI’s chain. On Thursday, SUI’s daily trading volume reached $4.57 billion, the highest level since its launch.
%20[09.47.44,%2006%20Dec,%202024]-638690740413451424.png)
SUI daily trading volume chart. Source: Santiment
Coinglass’s data shows that the futures’ Open Interest (OI) in SUI at exchanges rose from $813.45 million on Thursday to $991.51 million on Friday, reaching the highest level since its launch in May 2023. An increasing OI represents new or additional money entering the market and new buying, hinting at a potential a rally ahead in the Sui price.
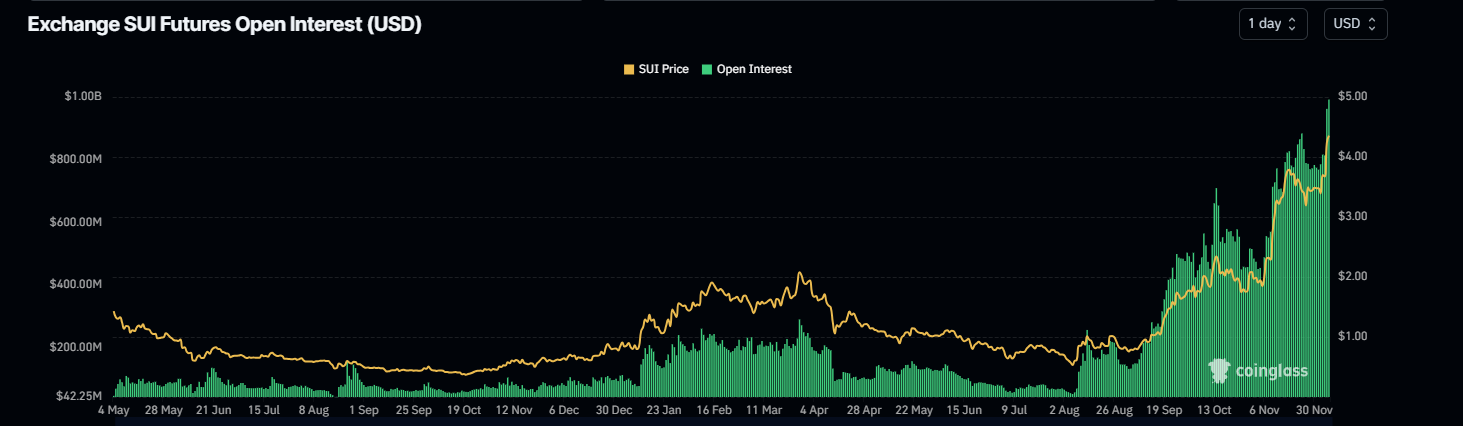
SUI Open Interest chart. Source: Coinglass
Meanwhile, data from crypto intelligence tracker DefiLlama shows that Sui’s TVL increased from $1.65 billion on Tuesday to $1.85 billion on Friday, a new ATH. This increase in TVL indicates growing activity and interest within the Sui ecosystem, suggesting that more users deposit or utilize assets within SUI-based protocols, adding credence to the bullish outlook.
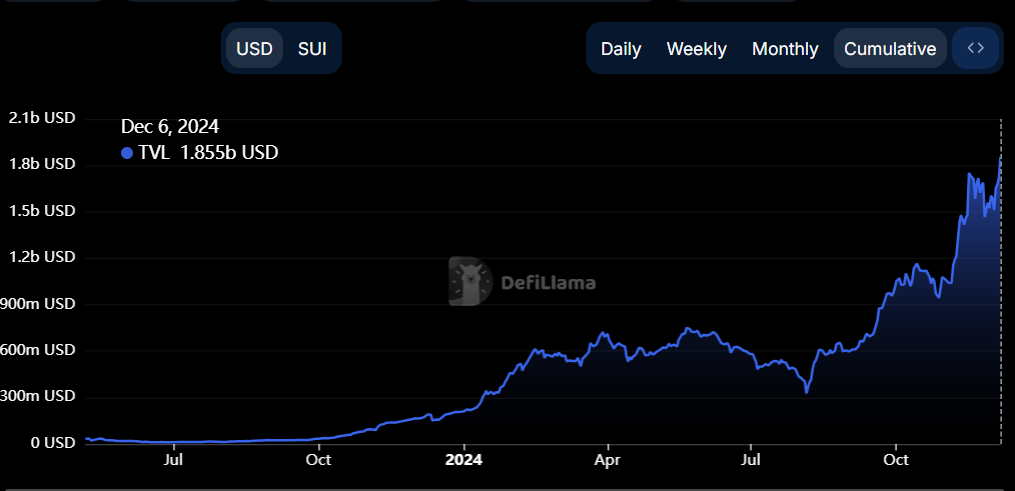
SUI TVL chart. Source: DefiLlama
Author

Manish Chhetri
FXStreet
Manish Chhetri is a crypto specialist with over four years of experience in the cryptocurrency industry.


