Sui Price Forecast: SUI bulls eyes for a new all-time high of $6.35
- Sui's price recovers more than 6% on Friday after declining more than 10% earlier this week.
- On-chain metrics hint at a rally ahead as SUI’s long-to-short ratio reaches the highest level in over a month, and open interest is also rising.
- A daily candlestick close below $4.45 would invalidate the bullish thesis.
Sui (SUI) price recovers most of its weekly losses and trades around $5.06 at the time of writing on Friday. On-chain metrics hint at a rally ahead as SUI’s long-to-short ratio reaches the highest level in over a month, and open interest is also rising. The technical outlook suggests a rally continuation, projecting a new all-time high (ATH) of $6.35.
Sui bulls eye for a new all-time high of $6.35
Sui price reached an all-time high of $5.36 on Monday and declined in the following days to find support around the 61.8% Fibonacci retracement, drawn from its November 26 low of $2.96 to its all-time high of $5.36, at $4.45 on Wednesday and Thursday. At the time of writing on Friday, it trades higher and approaches its ATH level.
If SUI continues its upward momentum, it could extend the rally to a new all-time high of $6.35, the 141.40% Fibonacci extension level.
The Relative Strength Index (RSI) on the daily chart reads 60, above its neutral level of 50, and points upwards, indicating bullish momentum. The Moving Average Convergence Divergence (MACD) indicator also shows a bullish crossover, signaling a buy signal and suggesting the continuation of the uptrend.
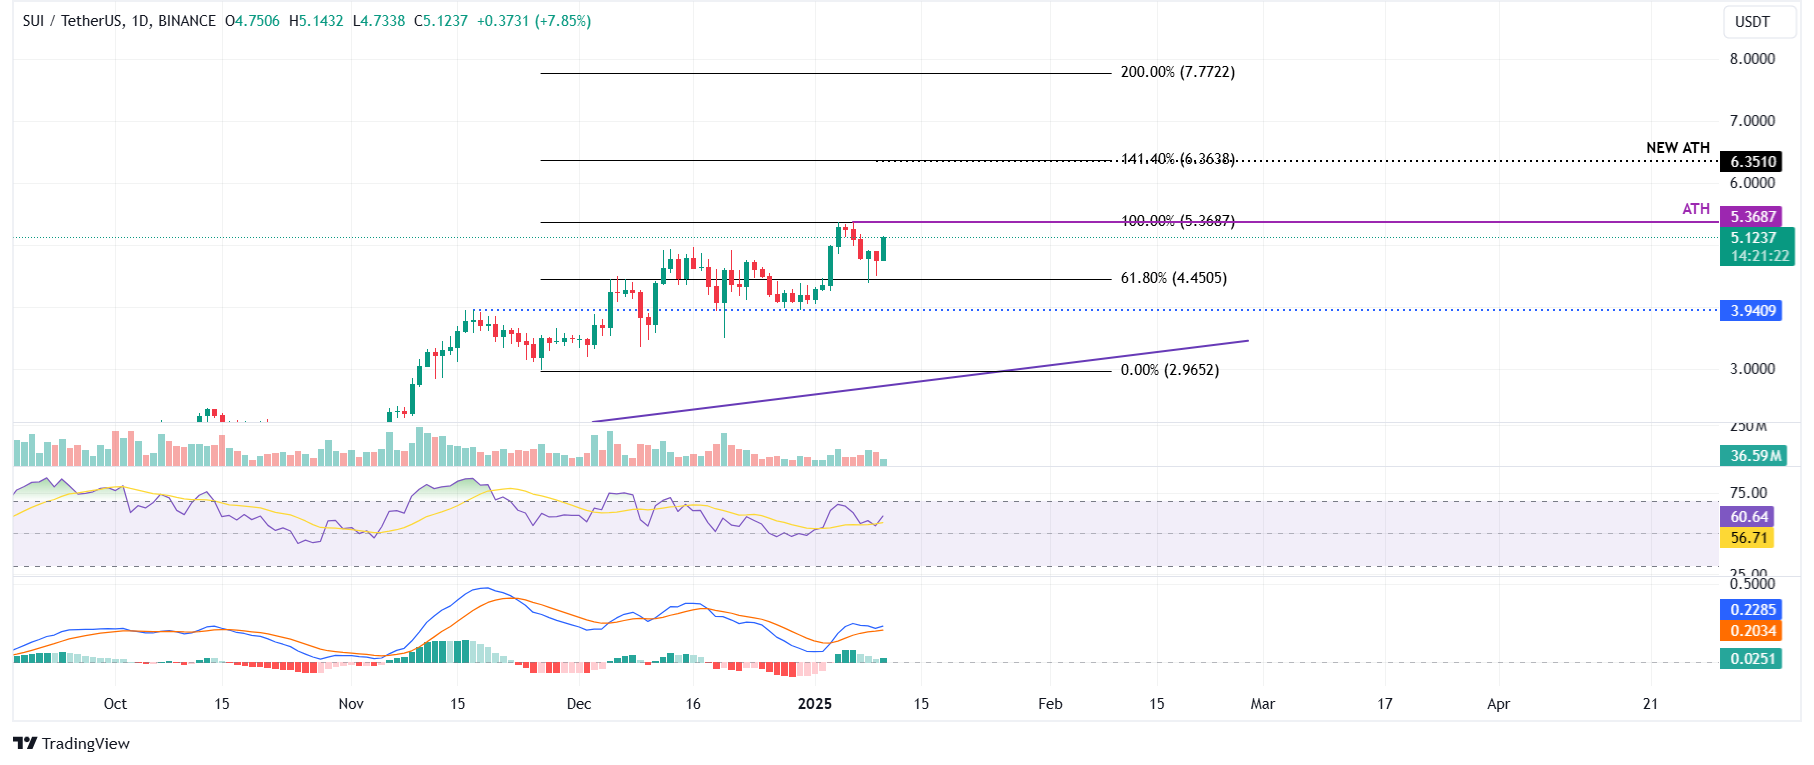
SUI/USDT daily chart
Looking at Sui’s Open Interest (OI) further boosts the bullish outlook. Coinglass’s data shows that the futures’ OI in SUI at exchanges rose from $1.20 million on Wednesday to $1.32 billion on Friday, rising since early January. An increasing OI represents new or additional money entering the market and new buying, which suggests a rally ahead in the Sui price.
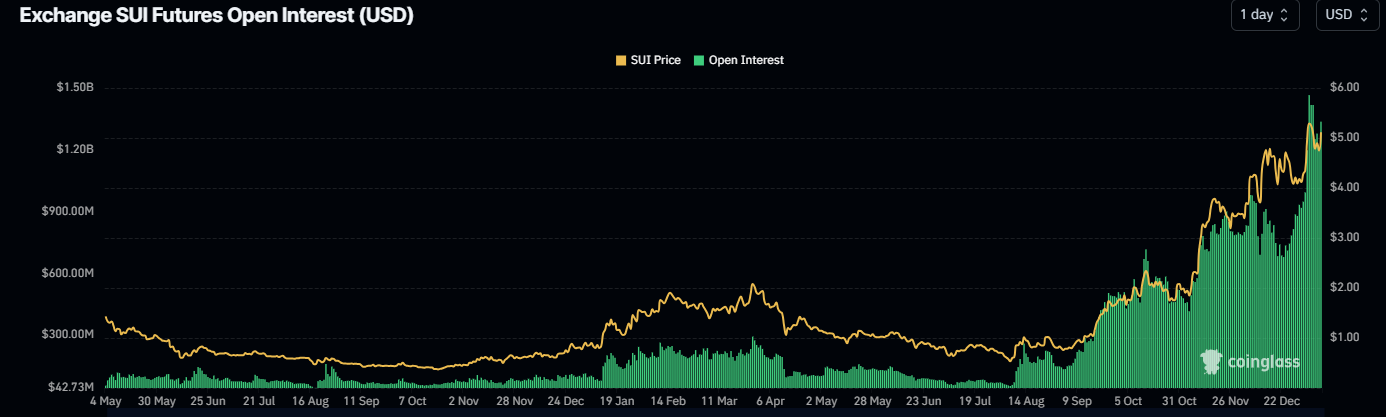
SUI Open Interest chart. Source: Coinglass
Another bullish sign is Coinglass’s SUI long-to-short ratio, which reads 1.13, the highest level in over a month. This ratio above one reflects bullish sentiment in the markets as more traders are betting for the Sui price to rise.
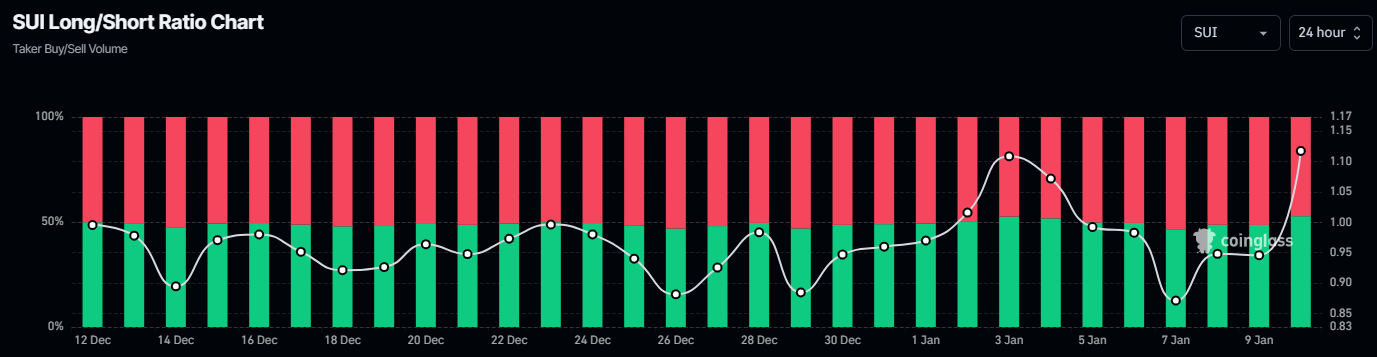
SUI long-to-short ratio chart. Source: Coinglass
However, if Sui’s daily candlestick closes below the $4.45 support, the bullish thesis would be invalidated, leading to a price decline to retest its next daily support at $3.94.
Author

Manish Chhetri
FXStreet
Manish Chhetri is a crypto specialist with over four years of experience in the cryptocurrency industry.