Solana vs. Ethereum: Altcoin season heats up as Bitcoin price drops below $100,000
- Solana and Ethereum are neck-and-neck in terms of protocol fees and DEX volume this month.
- Solana outperformed Ethereum in key on-chain metrics throughout October and November.
- Bitcoin slips under $100,000 and BTC dominance stalls, altcoin season persists.
- Technical indicators point at a likelihood of gains in Solana and Ethereum.

Solana (SOL) left Ethereum (ETH) behind in terms of on-chain metrics like protocol fees and decentralized exchange (DEX) volumes in October and November. However, metrics show that in the first six days of December, the two altcoins are neck-and-neck as the altcoin season persists.
Bitcoin suffered a drop under $100,000 on Friday after hitting an all-time high at $104,088 on Thursday.
Solana and Ethereum compete in DEX metrics
Solana’s recent gains and rising market capitalization fueled the narrative of the “flippening,” meaning a scenario where SOL market cap exceeds that of ETH. Development of Solana’s meme coin ecosystem catalyzed gains in SOL.
Metrics comparing the two altcoins on TheBlock show the two are competing and are nearly at an equal level in terms of protocol fees and DEX volume. Solana outperformed Ethereum for two months straight in October and November, but the streak could end this month.
In terms of Total Value Locked (TVL) and stablecoin volume Ethereum dominates due to its network effect and the vast ecosystem of Layer-2 and Layer-3 chains. However, generating higher protocol fees puts Solana ahead of Ethereum in terms of decentralized exchange metrics.
Bitcoin dominance wanes, supporting altcoin season gains
Bitcoin dominance is consolidating around the 55% level. The altcoin season index at Blockchaincenter.net reads 86 on a scale of 0 to 100. The time period is marked by top 50 altcoins outperforming Bitcoin consistently for 90 days.
While most altcoins rallied alongside Bitcoin in its run to the $100,000 level, Solana and Ethereum could extend their gains per technical indicators.
Solana and Ethereum price forecast
Solana is gearing up for nearly 10% gains. The altcoin is currently trading close to the Fair Value Gap (FVG) and key support zone between $215.27 and $229.60.
Momentum indicator Relative Strength Index (RSI) reads 57 and is sloping upwards on the daily price chart. This supports a theory for further gains in SOL price. The altcoin is currently in a state of consolidation. However, once the inefficiency zone is filled, it is likely that SOL resumes its rally toward the all-time high at $264.39.
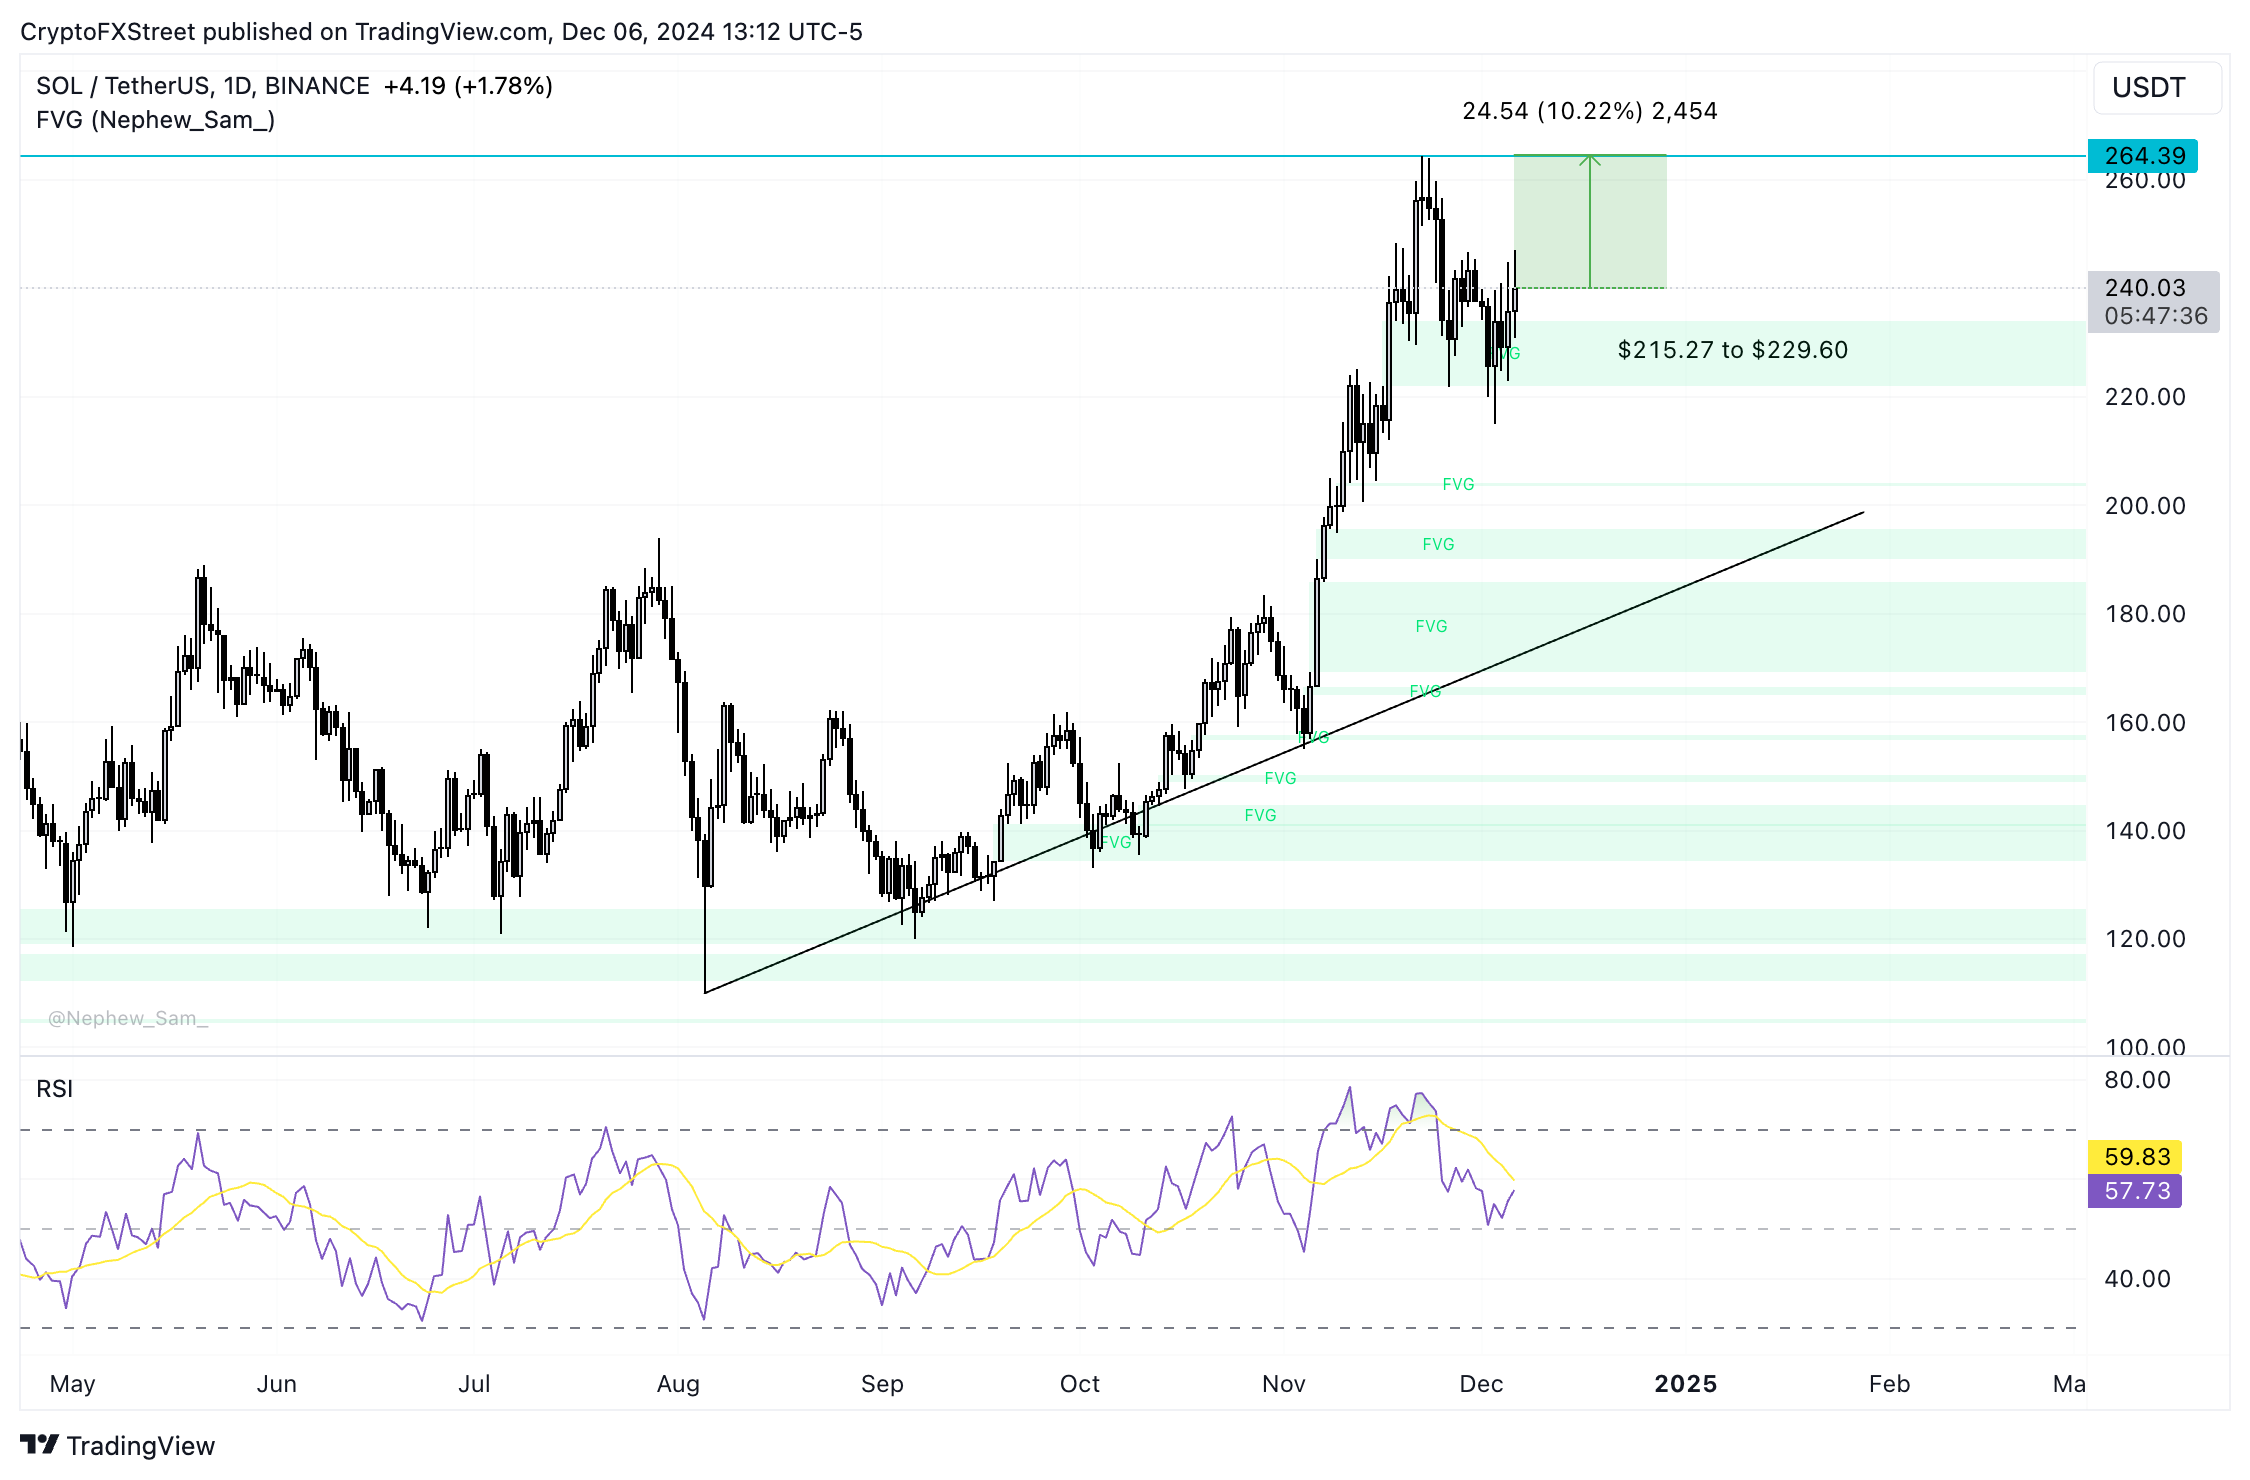
SOL/USDT daily price chart
A daily candlestick close under the $229.60 level could invalidate the bullish thesis for SOL.
Ethereum (ETH) could retest its previous all-time high at $4,868 if it continues its climb. The Moving Average Convergence Divergence (MACD) indicator and the Relative Strength Index (RSI) support a thesis for gains in Ether.
The green histogram bars above the neutral line on MACD and the RSI reading 66 and sloping upwards support a bullish thesis for Ethereum.
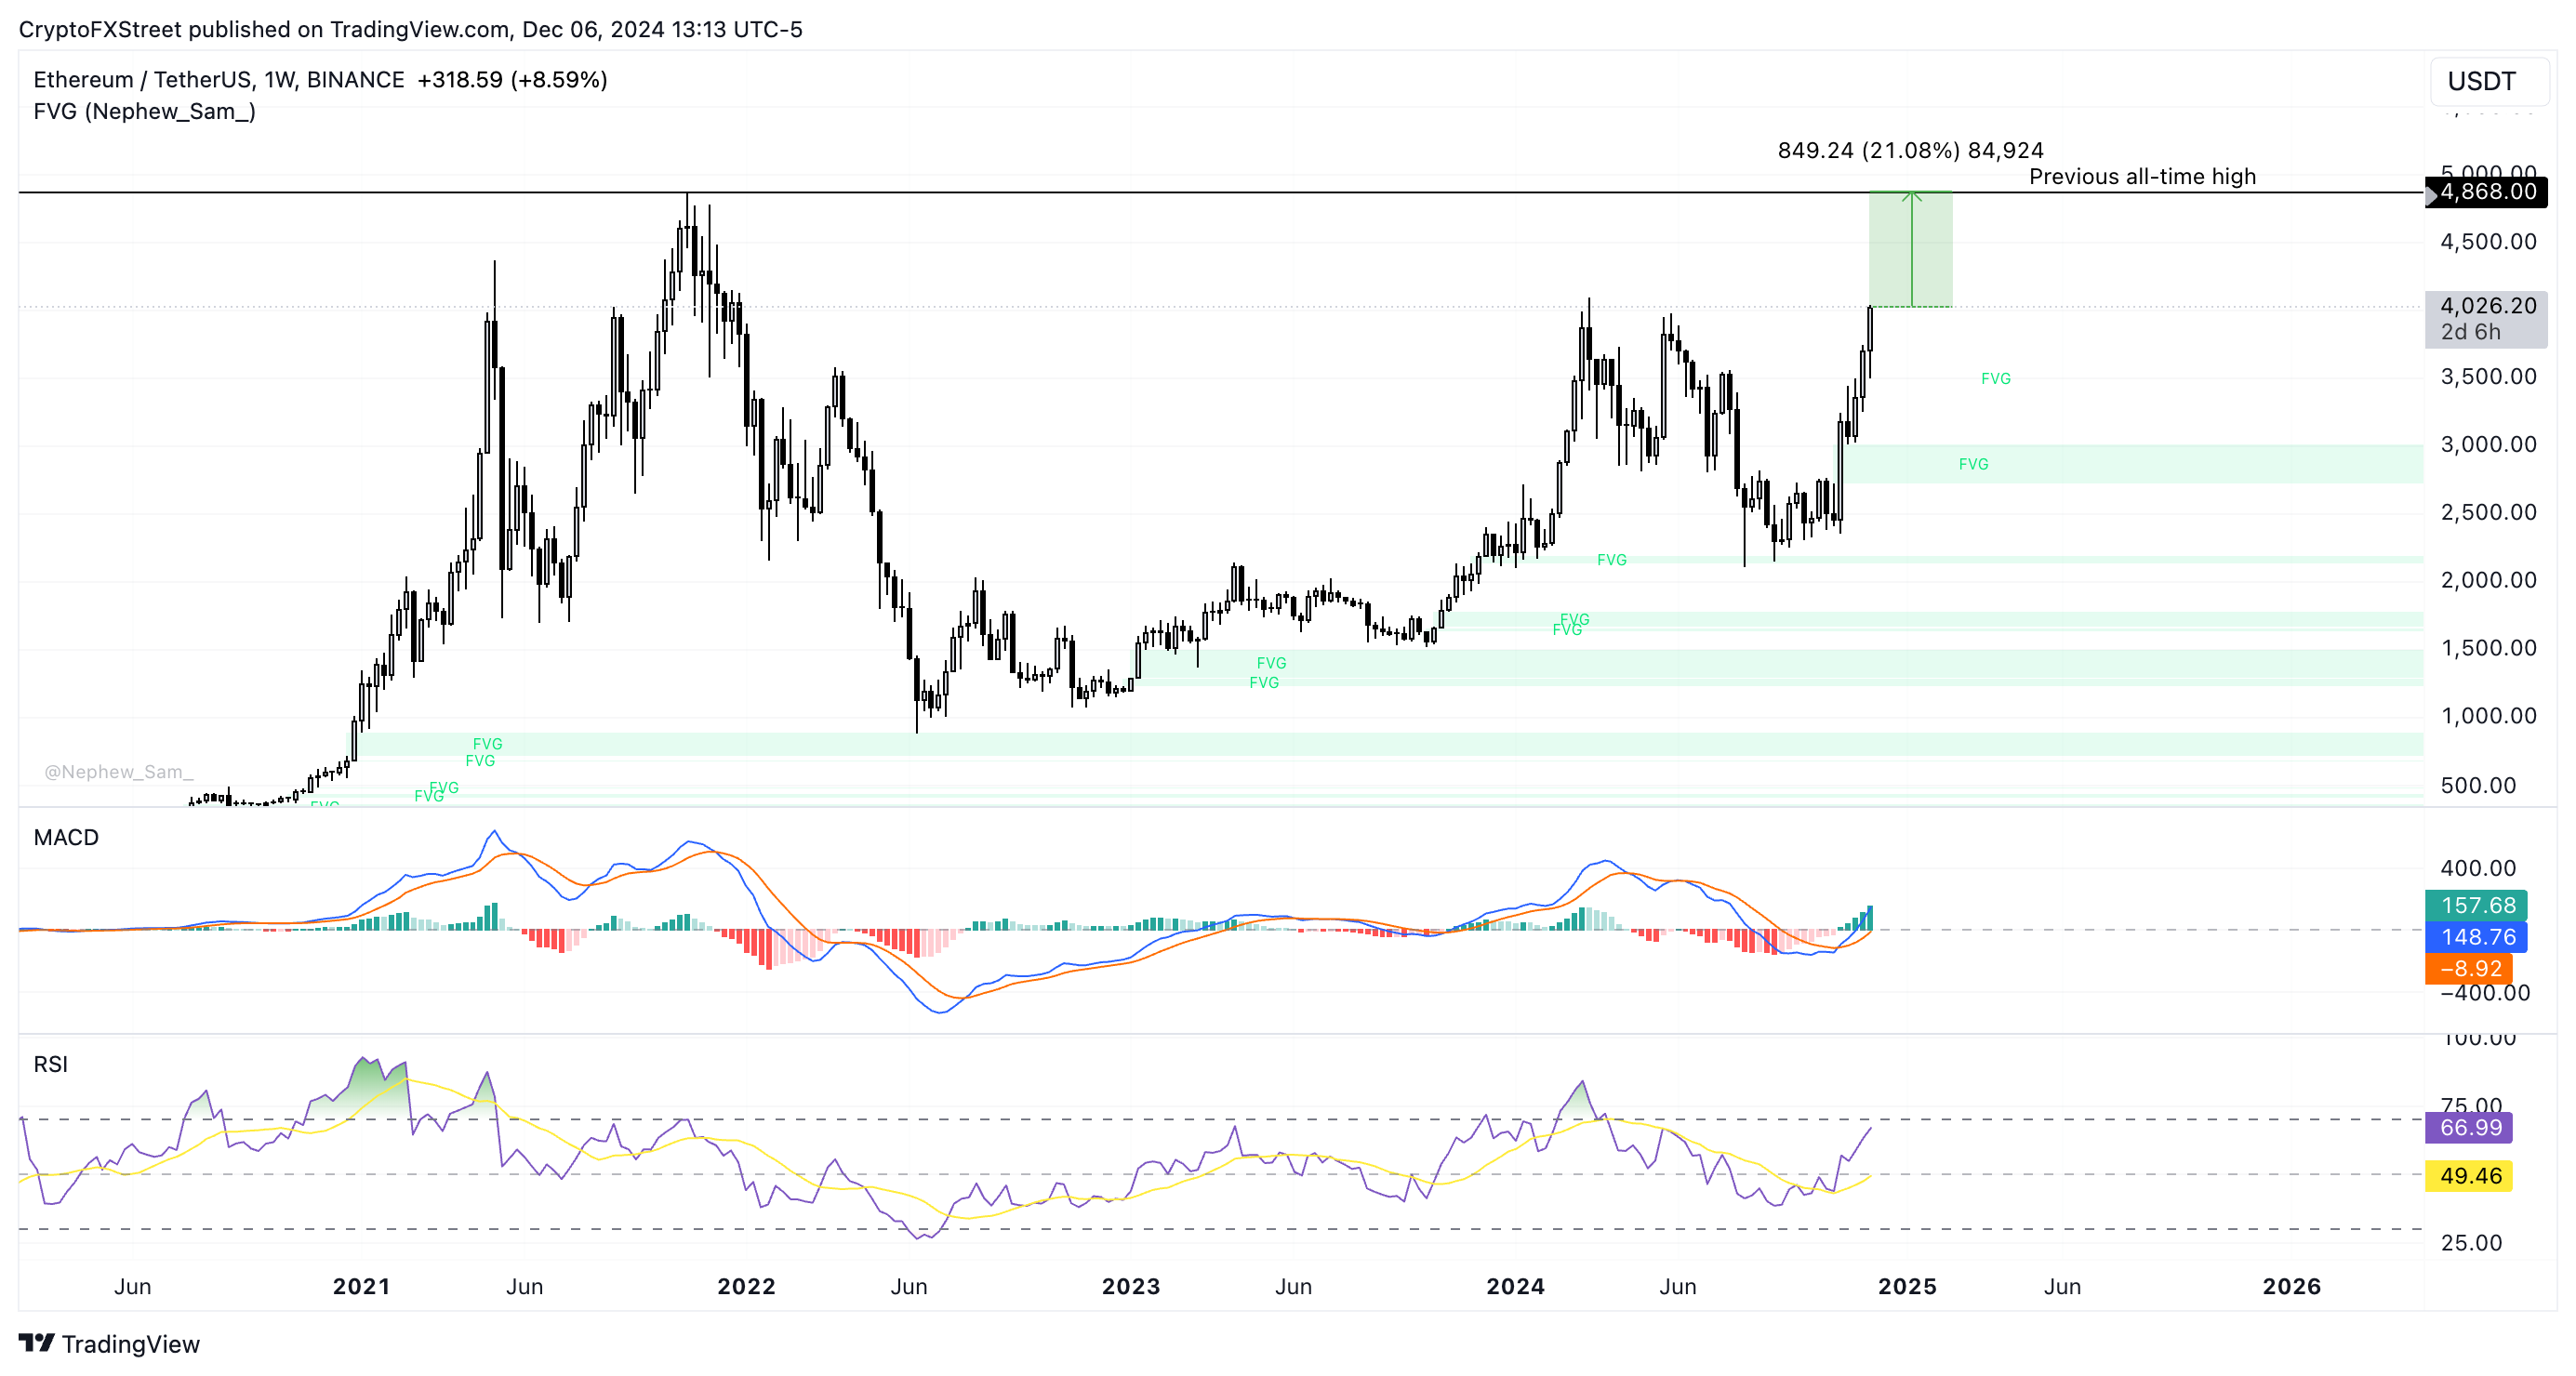
ETH/USDT daily price chart
If Ethereum sees a daily candlestick close under the upper boundary of the FVG between $3,500 and $3,497, it could invalidate the bullish thesis. ETH could slip under the psychological barrier at $3,000.
Author

Ekta Mourya
FXStreet
Ekta Mourya has extensive experience in fundamental and on-chain analysis, particularly focused on impact of macroeconomics and central bank policies on cryptocurrencies.


