Solana price to drop another 50% as SOL looks for support
- Solana price positioned for a massive sell-off, dwarfing Saturday's flash crash.
- One of the most bearish Point and Figure patterns is now present.
- Upside potential exists but is risky and limited.

Solana price falls below the daily Ichimoku Cloud with the Chikou Span below the candlesticks and in open space – prime positioning for a start to a bear market. However, the true extent of how bearish Solana's future price behavior could be is represented best on a Point and Figure chart.
Solana price positioned for massive collapse to sub $100 levels
Solana price has developed one of the most sought-after short-selling patterns in Point and Figure analysis: the Bearish Catapult. This pattern's strength comes from its location: near the top of a trend. The Bearish Catapult pattern on Solana's chart is a textbook example.
The theoretical short idea is a sell stop order at $170, a stop loss at $200, and a profit target at $70. The profit target is derived from the Vertical Profit Target Method in Point and Figure analysis. A trailing stop of one or two boxes would help protect any implied profit post entry.
However, any short-sellers should beware that a move to $70 is not without difficulty. The $140 value area is where the second largest high-volume node for 2021 exists. Below that, another high volume node and the 38.2% Fibonacci retracement at $110 is also an important support area. The bottom of the anticipated correction could be found at either of those levels.
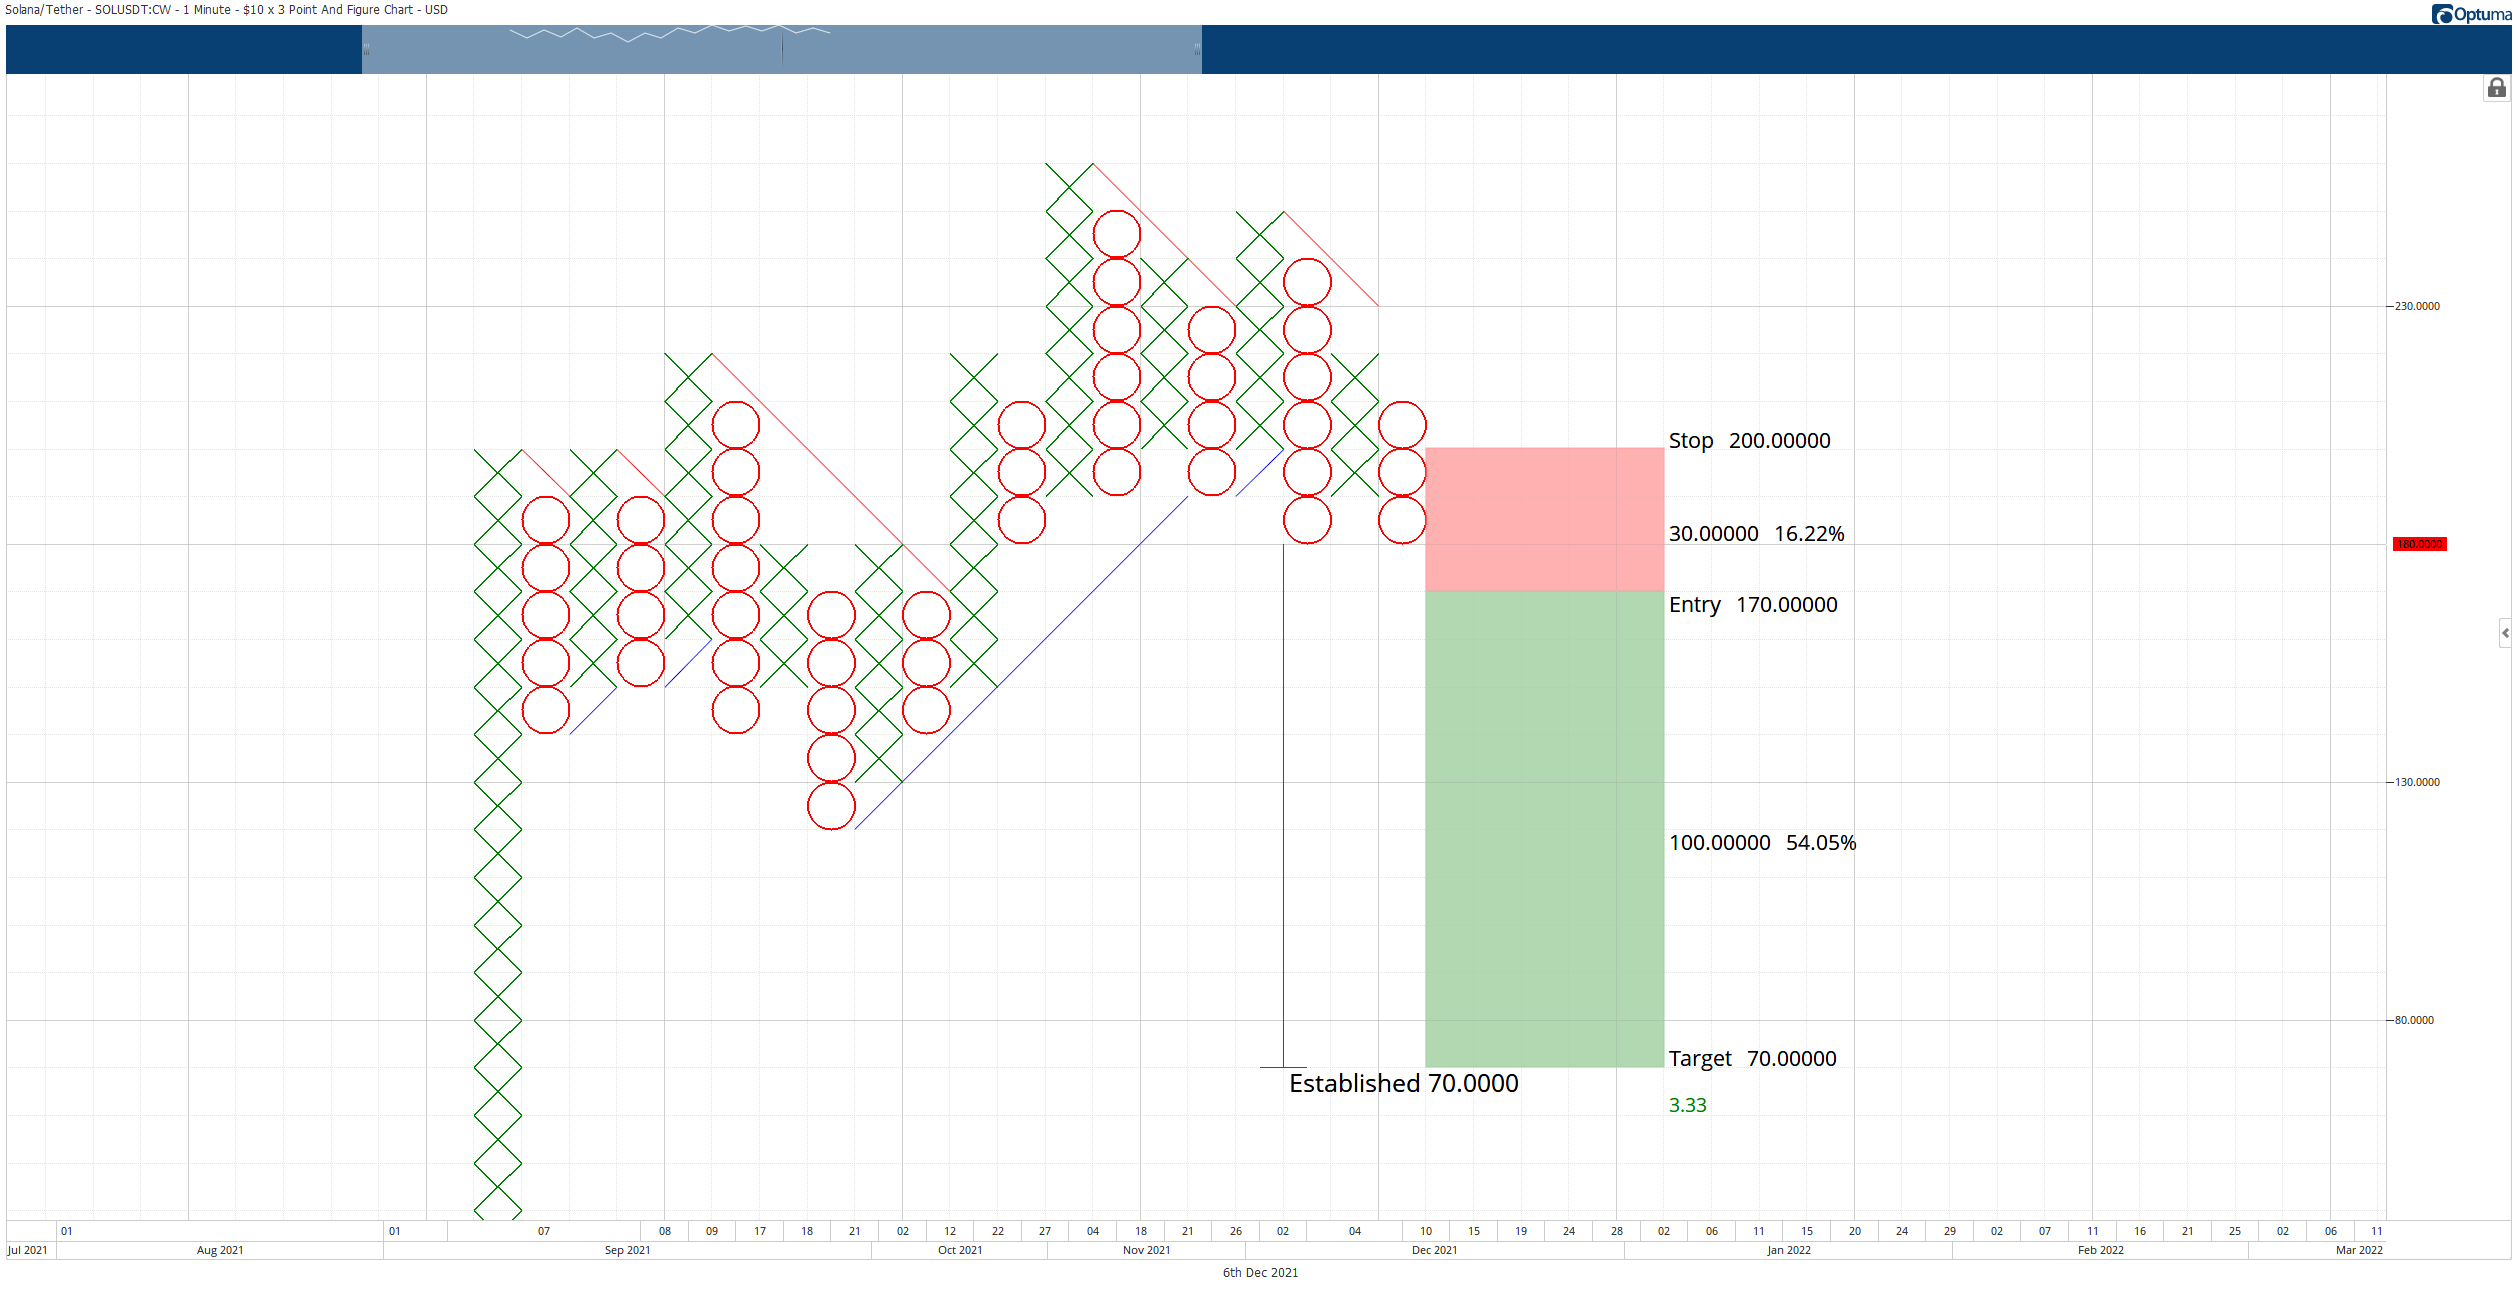
SOL/USDT $10/3-box Reversal Point and Figure Chart
The short idea is invalidated if Solana price were to move to $230. In that scenario, a bullish continuation is likely to occur because Solana will have simultaneously moved above a critical high volume node and convert the $10/3-box reversal Point and Figure chart into a bull market.
Author

Jonathan Morgan
Independent Analyst
Jonathan has been working as an Independent future, forex, and cryptocurrency trader and analyst for 8 years. He also has been writing for the past 5 years.


