Solana price fails to break trend with longs likely to suffer
- Solana price remains trapped within a bearish technical formation after a rejection from the 21EMA at $19.51.
- SOL could fall 10% below the last lower high at around $17.29, potentially opening the drains for a prolonged downtrend.
- This outlook would be invalidated upon a decisive daily candlestick close above $20.23.

Solana (SOL) price remains trapped within a bearish technical pattern and could continue south unless bullish momentum returns to the market. The situation could have been worse if not for the blocks imposed by the court when it allowed the liquidation of FTX exchange's $3.4 billion crypto.
Also Read Solana price readies for a fall after FTX gets approval to dump $3.4 billion worth of crypto.
Solana price faces rejection from 21-EMA
Solana (SOL) price was rejected by the 21-day Exponential Moving Average (EMA)at $19.51 after a bullish attempt to escape from the descending parallel channel. As it stands, the Ethereum (ETH) killer remains trapped within the bearish technical formation and could continue falling for as long as SOL is within its confines.
The overall outlook points to an impending slump for Solana price, with falling momentum indicated by the Relative Strength Index (RSI). The Awesome Oscillator (AO) is also in the negative zone, adding credence to the bearish outlook.
Increased selling momentum could see SOL test the channel's midline at around the $18.00 psychological level. In the dire case, Solana price could extend the slump to the channel's lower boundary at $17.29.
In the dire case, the downtrend could dip Solana price into the demand zone, marked by the last candlestick before the July uptrend commenced. This area is primarily populated by buyers and could be the turnaround point for SOL.
However, if it fails to hold as a support level, a slip-through would render it a bearish breaker, extending the losses for Solana price, potentially toward the support floor at $14.49.
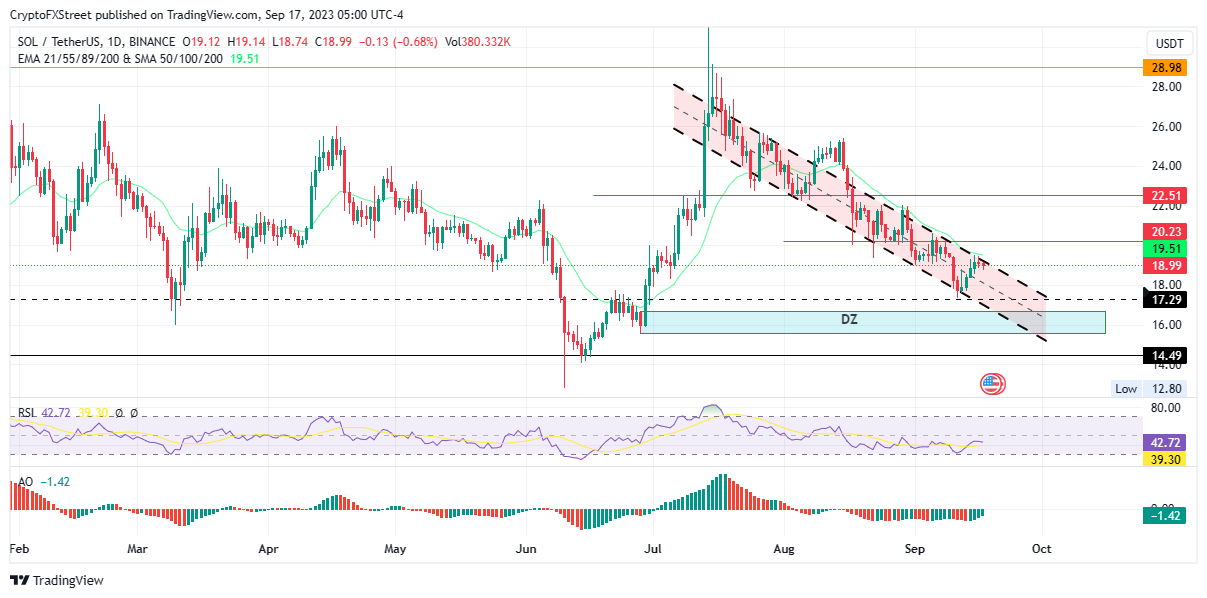
SOL/USDT 1-day chart
Liquidation data from CoinGlass shows that the amount of long positions already liquidated is forty-five times (45 times) that of shorts.
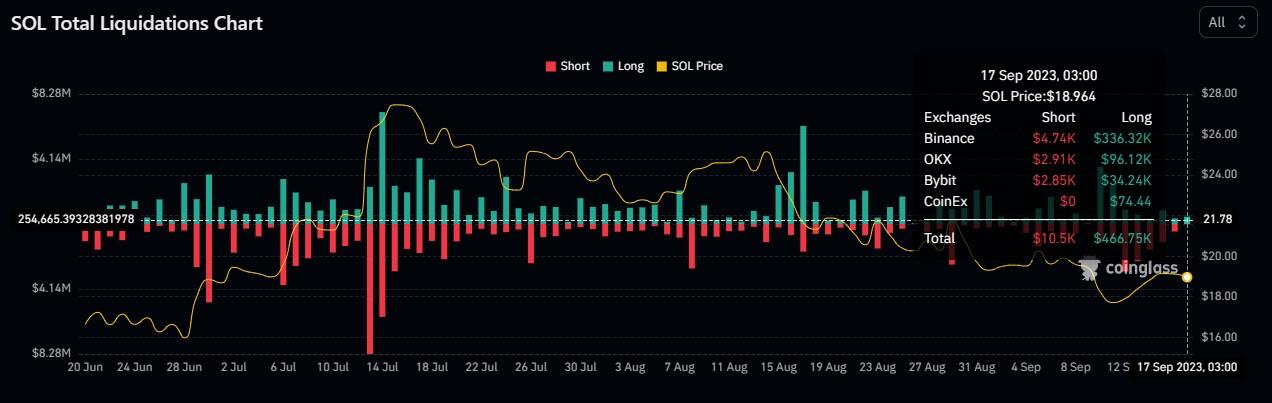
SOL liquidation
On the flip side, increased buying pressure above current levels, marked by a breach of the channel's upper boundary, and Solana's price overcoming the 21-day EMA at $19.51 could clear the path for an uptrend. Confirmation would occur upon a decisive close above $20.23.
In a bearish bullish case, the downtrend could reach the support floor at $14.49, constituting a 25% slump from current levels.
Cryptocurrency metrics FAQs
What is circulating supply?
The developer or creator of each cryptocurrency decides on the total number of tokens that can be minted or issued. Only a certain number of these assets can be minted by mining, staking or other mechanisms. This is defined by the algorithm of the underlying blockchain technology. Since its inception, a total of 19,445,656 BTCs have been mined, which is the circulating supply of Bitcoin. On the other hand, circulating supply can also be decreased via actions such as burning tokens, or mistakenly sending assets to addresses of other incompatible blockchains.
What is market capitalization?
Market capitalization is the result of multiplying the circulating supply of a certain asset by the asset’s current market value. For Bitcoin, the market capitalization at the beginning of August 2023 is above $570 billion, which is the result of the more than 19 million BTC in circulation multiplied by the Bitcoin price around $29,600.
What is trading volume?
Trading volume refers to the total number of tokens for a specific asset that has been transacted or exchanged between buyers and sellers within set trading hours, for example, 24 hours. It is used to gauge market sentiment, this metric combines all volumes on centralized exchanges and decentralized exchanges. Increasing trading volume often denotes the demand for a certain asset as more people are buying and selling the cryptocurrency.
What is funding rate?
Funding rates are a concept designed to encourage traders to take positions and ensure perpetual contract prices match spot markets. It defines a mechanism by exchanges to ensure that future prices and index prices periodic payments regularly converge. When the funding rate is positive, the price of the perpetual contract is higher than the mark price. This means traders who are bullish and have opened long positions pay traders who are in short positions. On the other hand, a negative funding rate means perpetual prices are below the mark price, and hence traders with short positions pay traders who have opened long positions.
Author

Lockridge Okoth
FXStreet
Lockridge is a believer in the transformative power of crypto and the blockchain industry.


