Solana price loses uptrend; Is sideways movement next, or will 26% corrections follow?
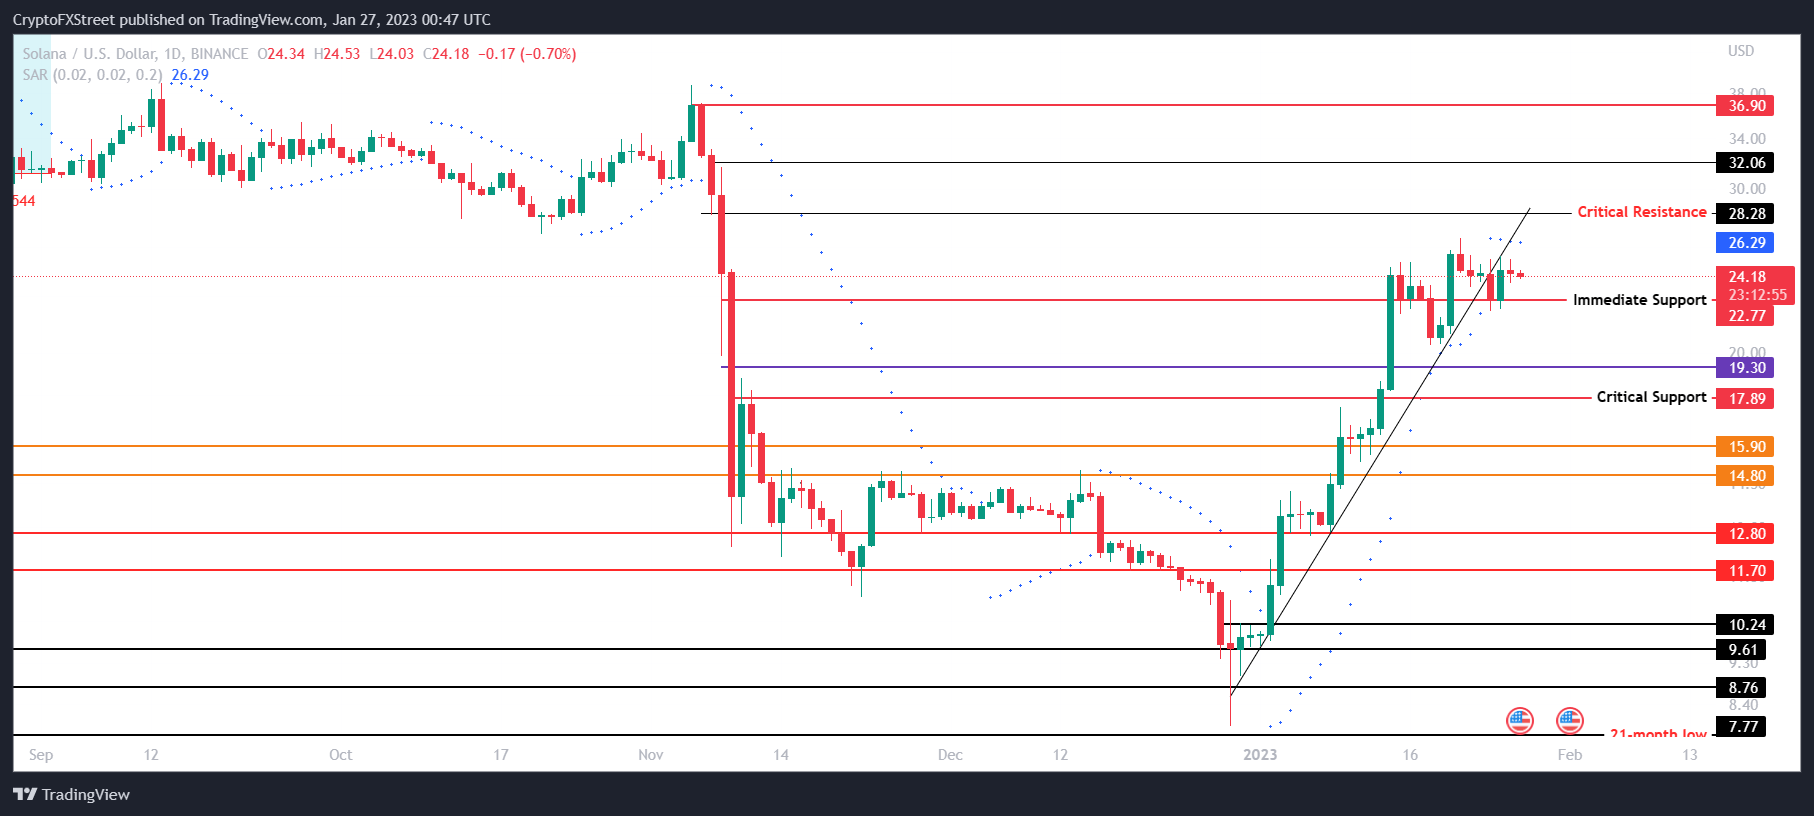
- Solana price is hovering around the $24 mark, standing right above the immediate support level at $22.77.
- The altcoin lost its almost four weeks longs uptrend, with the indicators also highlighting an active downtrend.
- If bullish cues take over and SOL rises above the critical resistance at $28.28, the bearish thesis will be invalidated.

Solana price impressed traders and investors alike this month when the altcoin marked an exceptional rally of more than 150% to touch the $26 mark. Although, at the moment, the movement is slow, the altcoin is susceptible to further decline in value if it loses this level as well.
Solana price reverses direction
Solana price on the daily chart has been moving sideways over the last few trading sessions after the uptrend took a break since January 20. This sideways movement also invalidated the month-long uptrend resulting in the price being stuck around $23.93.
If the broader market cues turn bearish and Solana price starts slipping, it will first face the immediate support at $22.77, losing which will result in the value of the altcoin further falling to the critical support at $17.89, marking a 26% decline.
Any more red candles from here on, and SOL will be back to the post-November 2022 crash.
The Parabolic Stop and Reverse (SAR) indicator highlights the probability of a slip in price high as well. The presence of the blue dots of the indicator above the candlesticks points in the same direction.
SOL/USD 1-day chart
However, if the cooldown ends and Solana price goes back to climbing the charts, recovery of the uptrend could be on the cards.
This would push the price toward the critical resistance at $28.28. A daily candlestick close above this level would invalidate the bearish thesis, putting SOL on the way toward $32.06 and further.
Author

Aaryamann Shrivastava
FXStreet
Aaryamann Shrivastava is a Cryptocurrency journalist and market analyst with over 1,000 articles under his name. Graduated with an Honours in Journalism, he has been part of the crypto industry for more than a year now.