Solana Price Forecast: SOL looks set to resume rally after recent correction, on-chain data shows
- Solana price rebounds after it found support around $205.41 on Tuesday.
- On-chain data shows signs of recovery as SOL’s daily trading volume rises and the long-to-short ratio reaches the highest level in a month.
- A daily candlestick close below $205.41 would invalidate the bullish thesis.
Solana (SOL) price recovers on Wednesday, finding support near the $205 level after a sharp pullback earlier in the week. On-chain data hints at a rally in the short term as SOL’s daily trading volume rises and the long-to-short ratio reaches the highest level in a month.
Solana technical outlook, on-chain data hint at recovery
Solana price reached a new all-time high (ATH) of $264.39 on November 22 and corrected afterward. SOL declined more than 16% in the next 17 days, retesting its 61.80% Fibonacci retracement level at $205.41, which is drawn from its August low of $110 to its ATH.
This level roughly coincides with the 50-day Exponential Moving Average (EMA) at $213.12 andthe daily support level of $213.12, making this area a key reversal zone. At the time of writing on Wednesday, SOL rebounds, trading around $220.
If the $205.41 continues to hold as support, the altcoin could go for another leg higher to retest its December 6 high of $247.
However, the Relative Strength Index (RSI) on the daily chart reads 46, still below its neutral level of 50, suggesting indecisiveness among traders. For the bullish momentum to resume, the RSI should trade above its neutral level. Such a development would add a tailwind to the recovery rally.
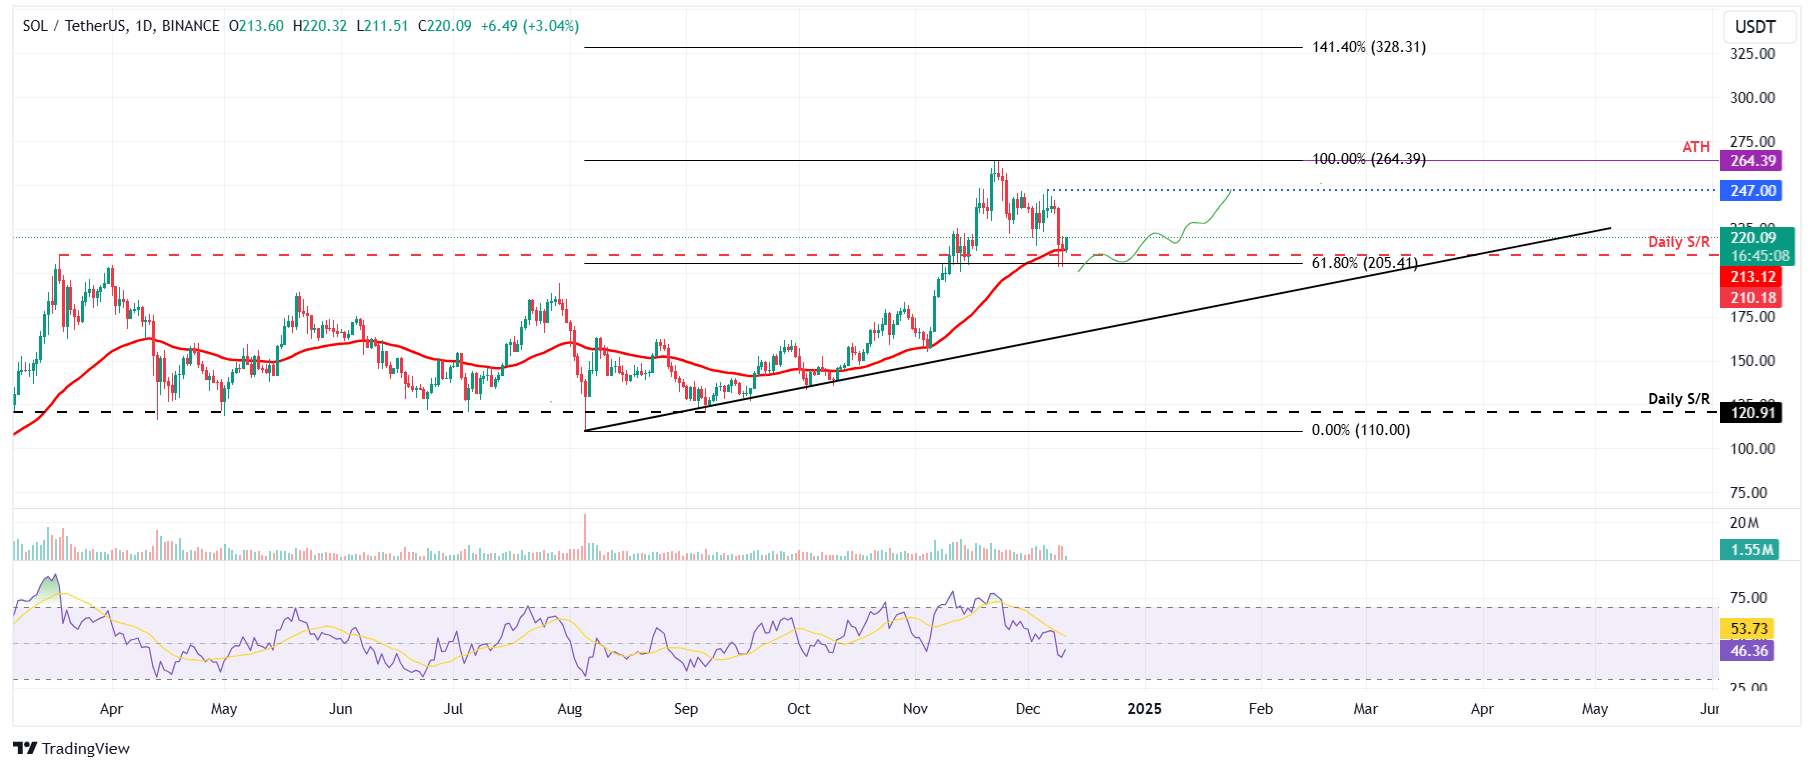
SOL/USDT daily chart
Meanwhile, on-chain metrics for Solana are positive. Crypto intelligence tracker DefiLlama data shows a recent surge in traders’ interest and liquidity in Solana’s chain. The daily trading volume has risen from $2.92 billion on Saturday to $5.99 billion on Wednesday, reaching the highest level since November 20.
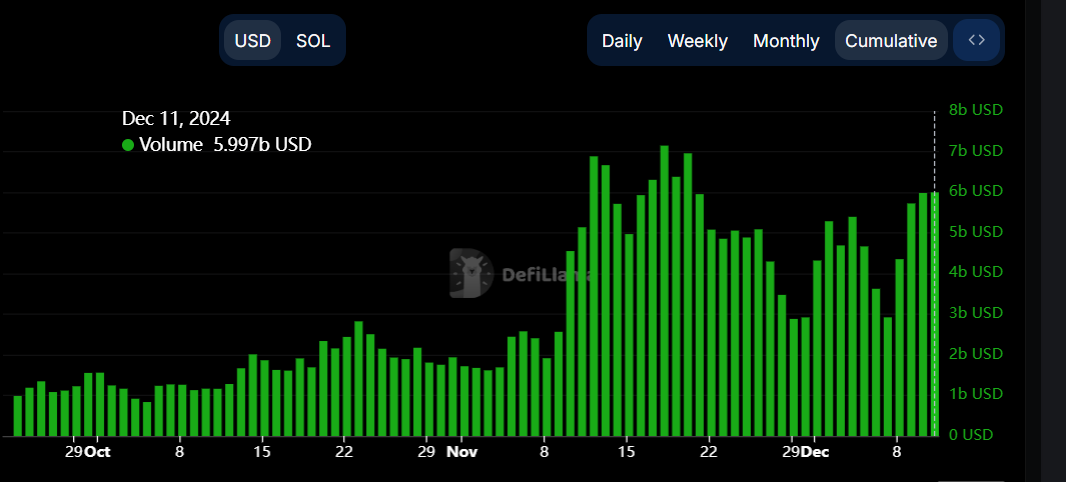
SOL daily trading volume chart. Source: DefiLlama
Coinglass’s data shows that SOL’s long-to-short ratio stands at 1.03, the highest level in a month. This ratio reflects bullish sentiment in the market, as a figure above one suggests that more traders anticipate the price of the altcoin to rise, bolstering Solana’s bullish outlook.
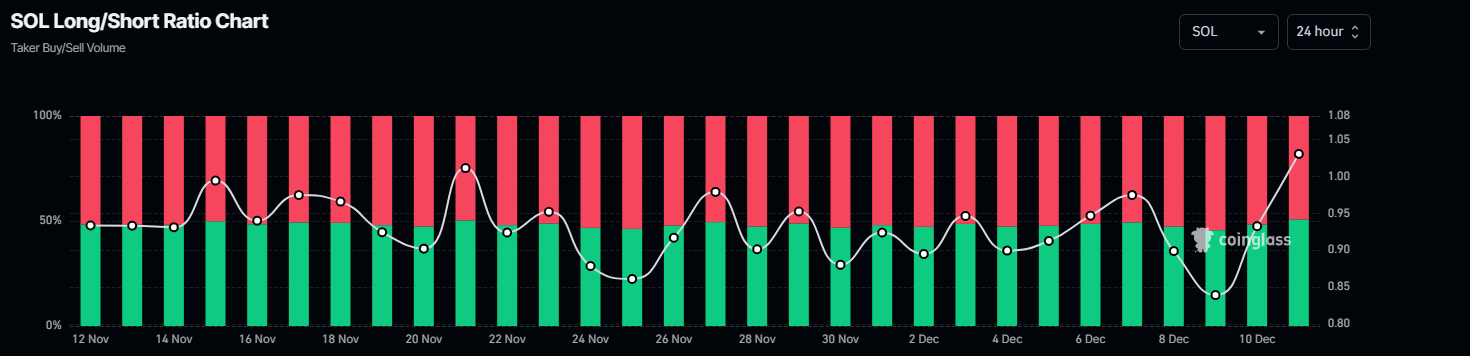
SOL long-to-short ratio chart. Source: Coinglass
However, if SOL’s daily candlestick closes below the $205.41 support level, the decline will resume to retest its psychologically important level of $200.
Author

Manish Chhetri
FXStreet
Manish Chhetri is a crypto specialist with over four years of experience in the cryptocurrency industry.


