Solana Price Forecast: Open Interest reaches an all-time high of $6.48 billion
- Solana price trades slightly down on Tuesday after rallying more than 12% in the previous week.
- On-chain data paints a bullish picture as SOL’s open interest reaches a new all-time high of $6.48 billion on Tuesday.
- A daily candlestick close below $260 would invalidate the bullish thesis.
Solana (SOL) price trades slightly down on Tuesday after rallying more than 12% the previous week. On-chain data hints for rallying continuation as SOL’s open interest reaches a new all-time high of $6.48 billion on Tuesday.
Solana bulls remain strong
Solana price broke above the descending trendline drawn by connecting multiple high levels from mid-November on Friday and rallying 4.6%. At the time of writing on Tuesday, it trades slightly down around $216.
If the trendline breakout level, which coincides with the 50-day Exponential Moving Average (EMA) at $206 holds as support, Solana price could extend the rally to retest its daily resistance level at $230.
The Relative Strength Index (RSI) on the daily chart reads at 56, above its neutral level of 50, indicating bullish momentum. Moreover, the Moving Average Convergence Divergence (MACD) indicator shows a bullish crossover on January 1, signaling a continuation of the uptrend.
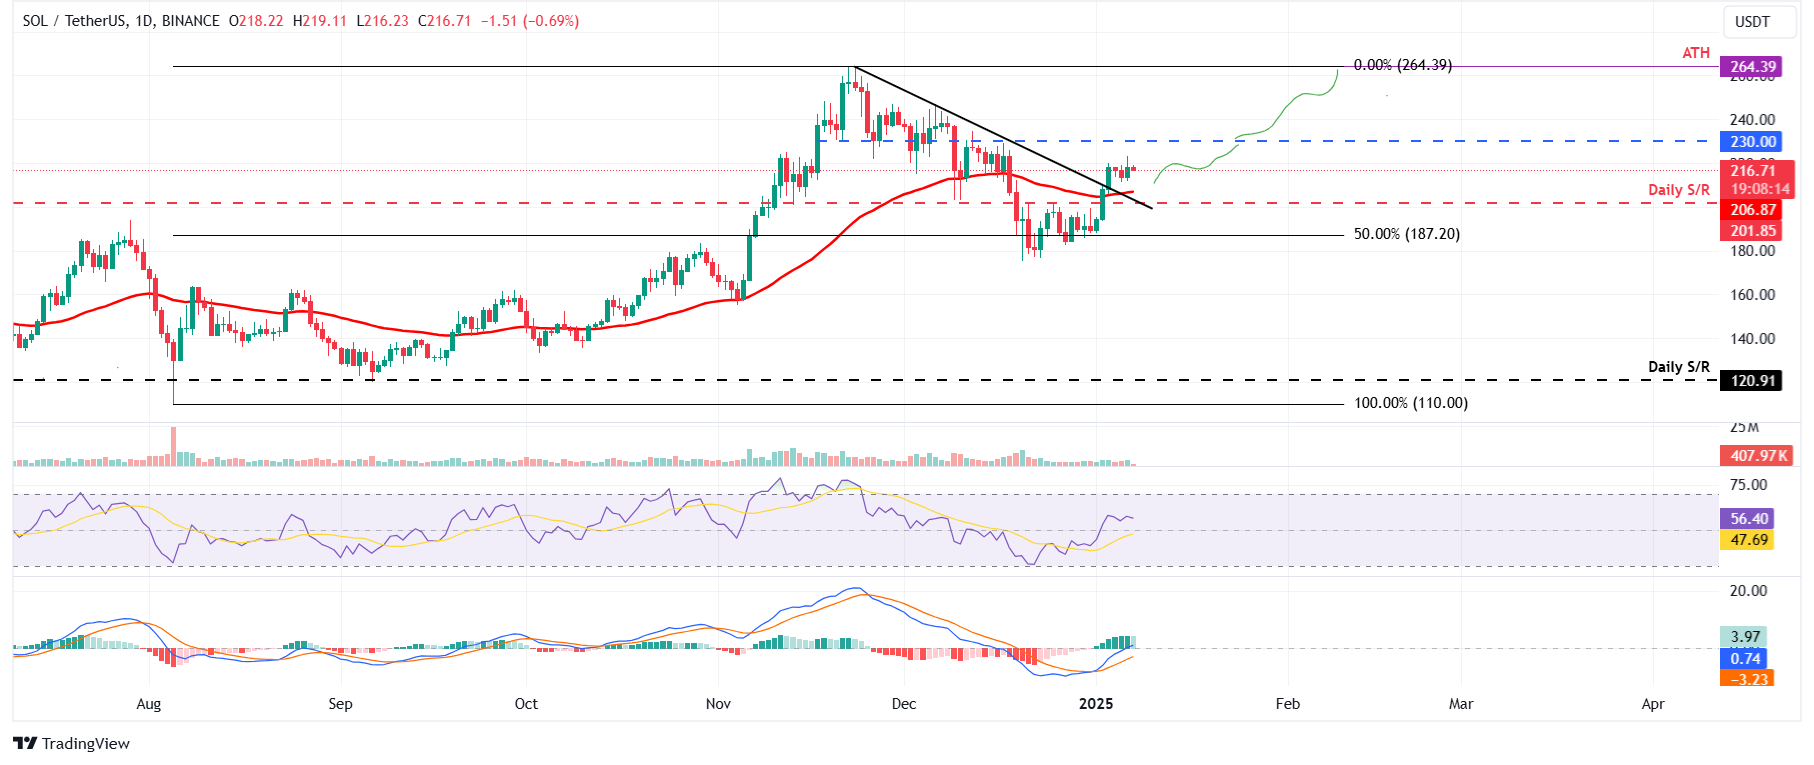
SOL/USDT daily chart
Looking at Solana's Open Interest (OI) provides a further boosts to the bullish outlook. Coinglass’s data shows that the futures’ OI in SOL at exchanges rose from $4.25 million on January 1 to $6.48 million on Tuesday, reaching a new all-time high (ATH). An increasing OI represents new or additional money entering the market and new buying, which suggests a rally ahead in the Solana price.
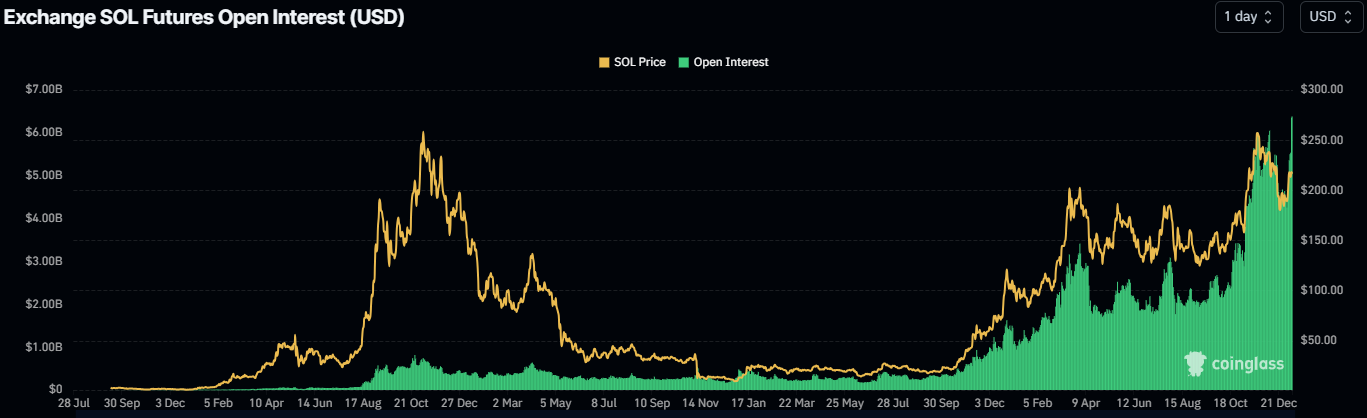
Solana Open Interest chart. Source: Coinglass
However, if SOL breaks and closes below $206, the bullish thesis would be invalidated, extending the decline to test its next daily support at $201.85.
Author

Manish Chhetri
FXStreet
Manish Chhetri is a crypto specialist with over four years of experience in the cryptocurrency industry.



