Top 3 Price Prediction Bitcoin, Ethereum, Ripple: BTC, ETH and XRP show signs of bullish momentum
- Bitcoin price is approaching its key level of $100,000; a firm close above would signal the continuation of the ongoing rally.
- Ethereum price closes above its upper consolidation level of $3,522, suggesting bullish momentum.
- Ripple price could rally if it breaks above the upper symmetrical triangle boundary.

Bitcoin’s (BTC) price is approaching its key psychological level of $100,000; a firm close above would signal the continuation of the ongoing rally. Ethereum (ETH) price closes above its upper consolidation level of $3,522, suggesting bullish momentum. While Ripple (XRP) price trades within a symmetrical triangle on Monday, a breakout from which could signal a rally ahead.
Bitcoin price shows potential for a rally ahead
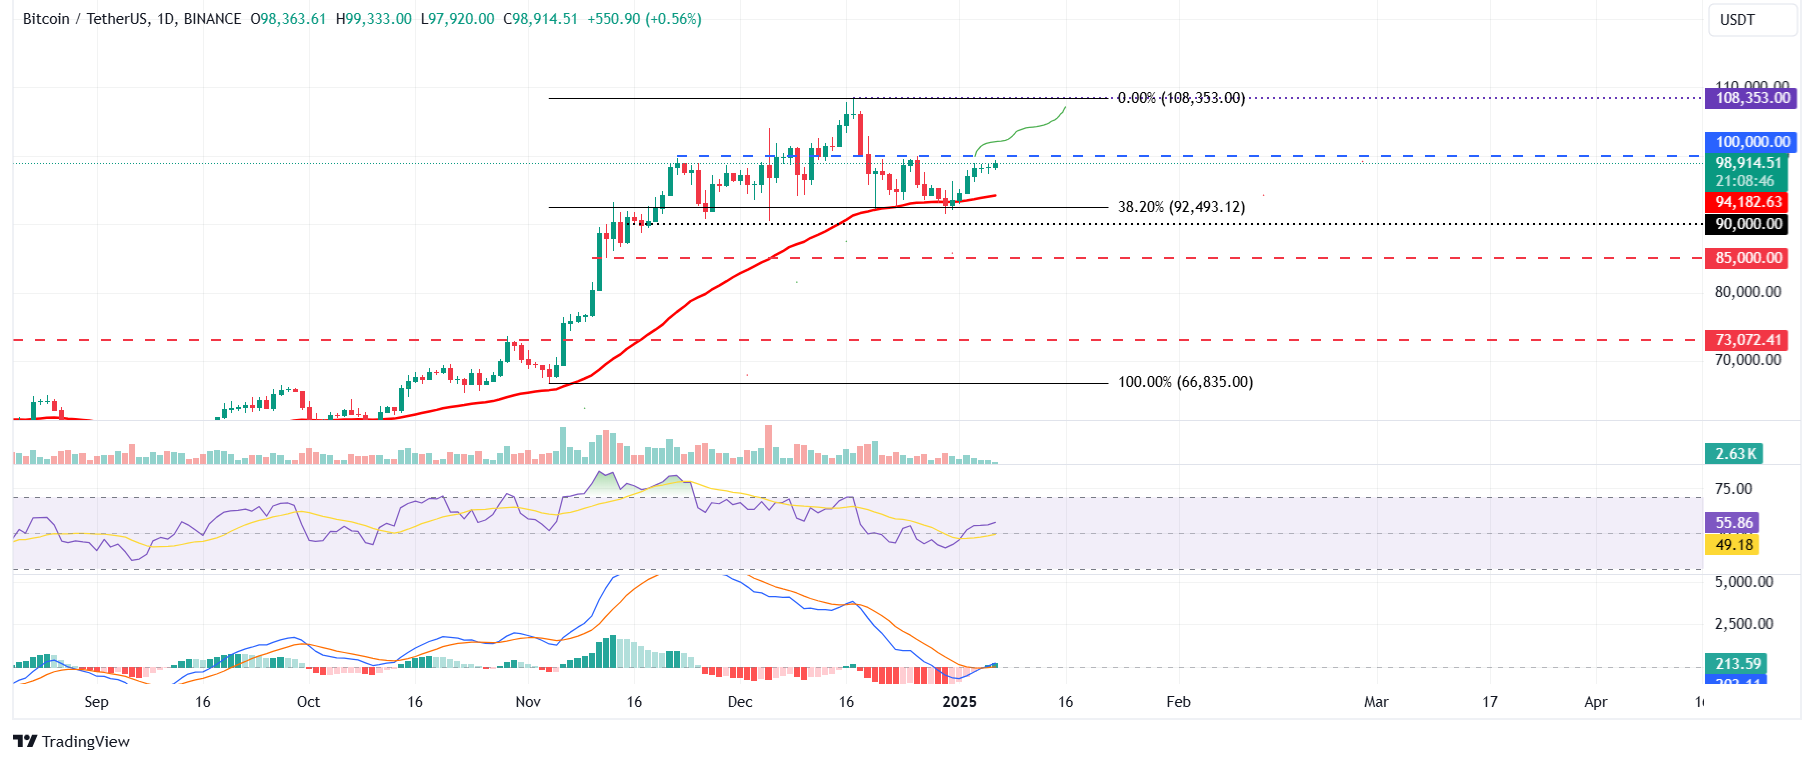
Bitcoin price found support around the 38.2% Fibonacci retracement level, drawn from the November 4 low of $66,835 to the December 17 high of $108,353, at $92,493 on December 30, 2024, and rose 6% in the next six days. This level roughly coincides with the 50-day Exponential Moving Average (EMA) at $94,182, making it a key zone. At the time of writing on Monday, BTC trades at around $98,900.
If BTC continues the upward momentum, it could extend its rally to retest its key psychological importance level of $100,000. A successful close above that level would extend an additional rally to retest its December 17, 2024, all-time high of $108,353.
The Relative Strength Index (RSI) on the daily chart reads 55, above its neutral value of 50, and it is pointing upwards, suggesting bullish momentum is gaining traction. Additionally, the Moving Average Convergence Divergence (MACD) indicator on the daily chart flipped a bullish crossover on Sunday, signaling a buy signal and continuation of an uptrend.
BTC/USDT daily chart
However, if BTC closes below the $92,493 level, it would extend the decline to retest its key support level at $90,000.
Ethereum is poised for a rally as it closes above its consolidation zone
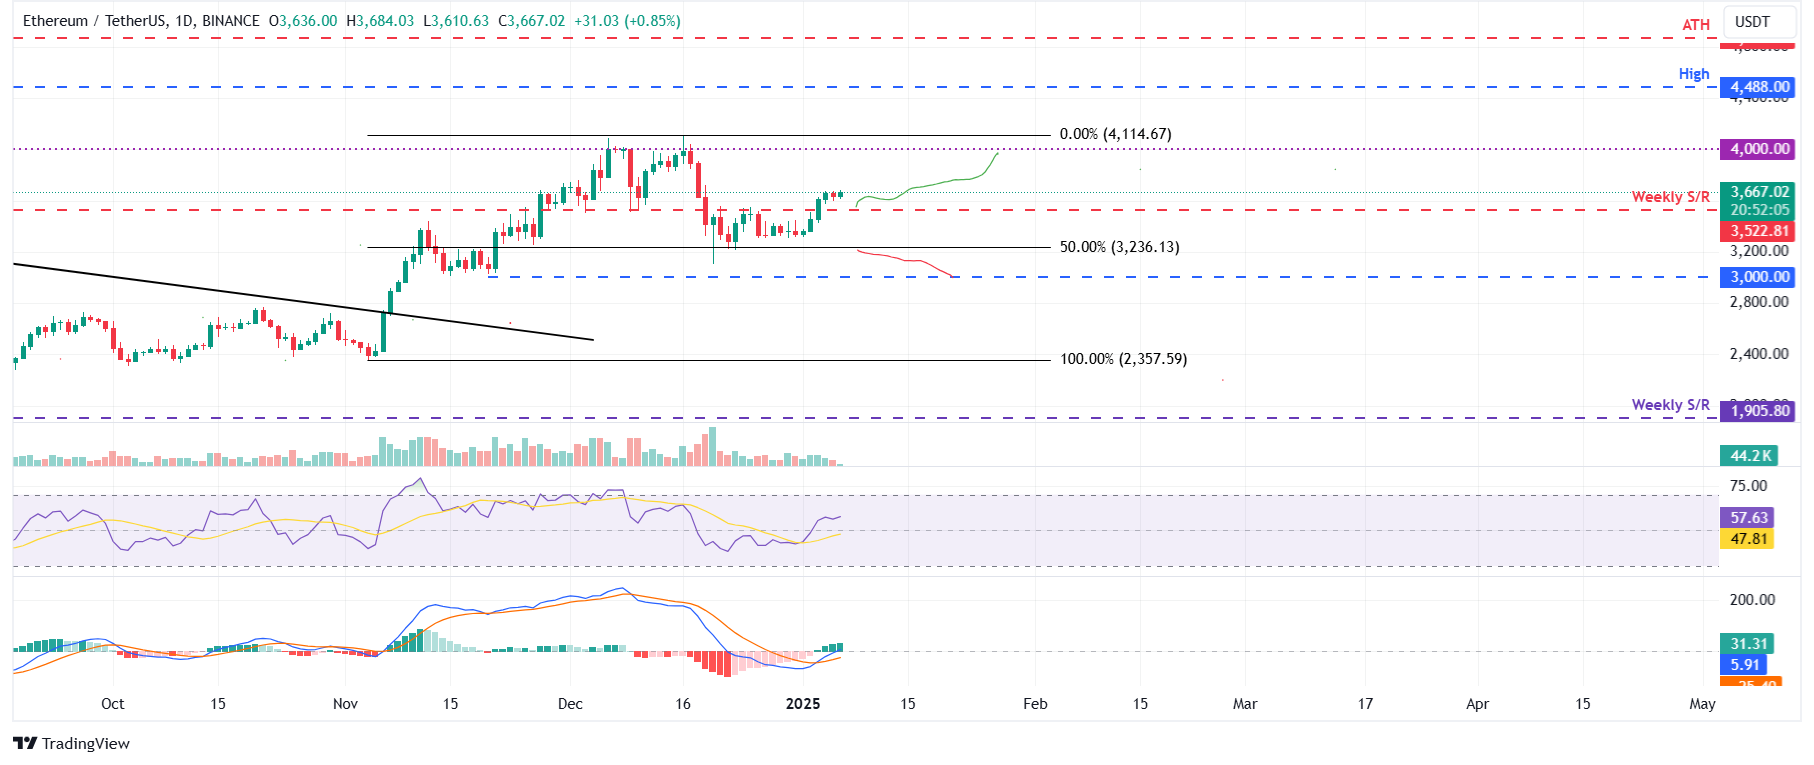
Ethereum price broke and closed above its upper consolidation level of $3,522 on Friday and rallied 1.6% until Sunday. At the time of writing on Monday, it continues to trade in green at around $3,667.
If ETH continues its upward trend, it would extend the rally to retest its psychological importance level of $4,000.
The RSI on the daily chart reads 57, above its neutral value of 50, and it is pointing upwards, suggesting bullish momentum is gaining traction. Moreover, like Bitcoin, the MACD indicator flipped a bullish crossover on the daily chart on Friday, signaling an upward trend.
ETH/USDT daily chart
On the other hand, if ETH breaks and closes below $3,236, it would extend the decline to retest its next support level at $3,000.
Ripple price could rally if it breaks above the symmetrical triangle pattern
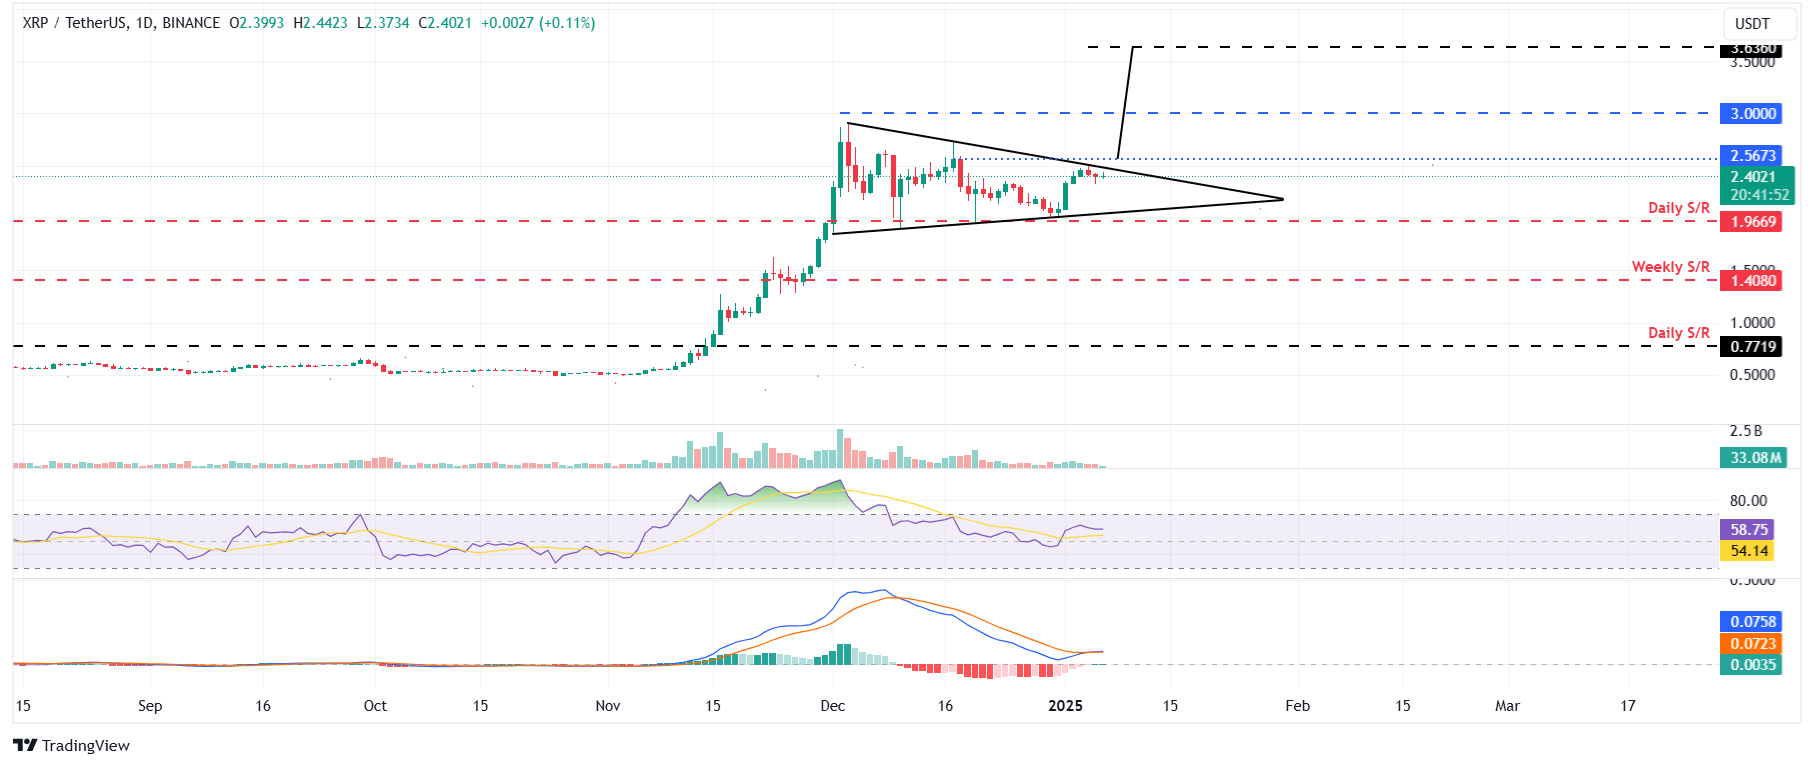
Ripple price trades inside a symmetrical triangle, a technical pattern formed by connecting multiple high and low with two converging trendlines (from early December to early January). This technical pattern has a bullish bias, and the target is generally obtained by measuring the distance between the first swing high and the first swing low to the breakout point. On Monday, Ripple trades at $2.40, approaching the triangle’s upper trendline.
Assuming the breakout happens by closing a daily candlestick above the daily resistance level at $2.56, the technical target obtained by this pattern would be $3.63. Investors should be cautious of this theoretical move as it could face a slowdown after a 17% rally to retest Ripple’s psychological importance level of $3.00 as traders could opt to book profits.
The RSI indicator reads 58, above its neutral value of 50, indicating a rise in bullish momentum. Additionally, the MACD indicator is above to flip a bullish crossover on the daily chart, signaling an upward trend on the horizon.
XRP/USDT daily chart
However, if XRP closes below the $1.96 daily support level, it would extend the decline to retest its next support level at $1.40.
Bitcoin, altcoins, stablecoins FAQs
Bitcoin is the largest cryptocurrency by market capitalization, a virtual currency designed to serve as money. This form of payment cannot be controlled by any one person, group, or entity, which eliminates the need for third-party participation during financial transactions.
Altcoins are any cryptocurrency apart from Bitcoin, but some also regard Ethereum as a non-altcoin because it is from these two cryptocurrencies that forking happens. If this is true, then Litecoin is the first altcoin, forked from the Bitcoin protocol and, therefore, an “improved” version of it.
Stablecoins are cryptocurrencies designed to have a stable price, with their value backed by a reserve of the asset it represents. To achieve this, the value of any one stablecoin is pegged to a commodity or financial instrument, such as the US Dollar (USD), with its supply regulated by an algorithm or demand. The main goal of stablecoins is to provide an on/off-ramp for investors willing to trade and invest in cryptocurrencies. Stablecoins also allow investors to store value since cryptocurrencies, in general, are subject to volatility.
Bitcoin dominance is the ratio of Bitcoin's market capitalization to the total market capitalization of all cryptocurrencies combined. It provides a clear picture of Bitcoin’s interest among investors. A high BTC dominance typically happens before and during a bull run, in which investors resort to investing in relatively stable and high market capitalization cryptocurrency like Bitcoin. A drop in BTC dominance usually means that investors are moving their capital and/or profits to altcoins in a quest for higher returns, which usually triggers an explosion of altcoin rallies.
Author

Manish Chhetri
FXStreet
Manish Chhetri is a crypto specialist with over four years of experience in the cryptocurrency industry.



