Solana price edges lower as SOL bears prepare for 25% drop through a take of $170 first
- Solana price is at risk of falling 25% after it broke below a major level of support on December 10.
- SOL could be headed toward $128 if the bears continue to control the narrative.
- Even if the bulls manage to reverse the period of underperformance, multiple stiff obstacles lie ahead.

Solana price has fallen below a critical level and could now be headed for a 25% decline as momentum has shifted toward the downside. SOL struggles to reclaim higher levels as the Ethereum killer is prepared to plunge toward $128.
Solana price offers bearish bias
Solana price has sliced below the lower boundary of the descending parallel channel at $175 on December 10 on the 12-hour chart, suggesting a bearish outlook. The governing technical pattern projects a 25% nosedive toward $128 if the bulls fail to reverse the period of underperformance.
The first line of defense for Solana price is at the 61.8% Fibonacci retracement level at $170. Additional footholds may appear at the October 6 high at $162, then at the October 11 high at $153.
Solana price may also discover support at the 78.6 Fibonacci retracement level, which sits at $146. If selling pressure increases further, SOL may fall toward the pessimistic target at $128.
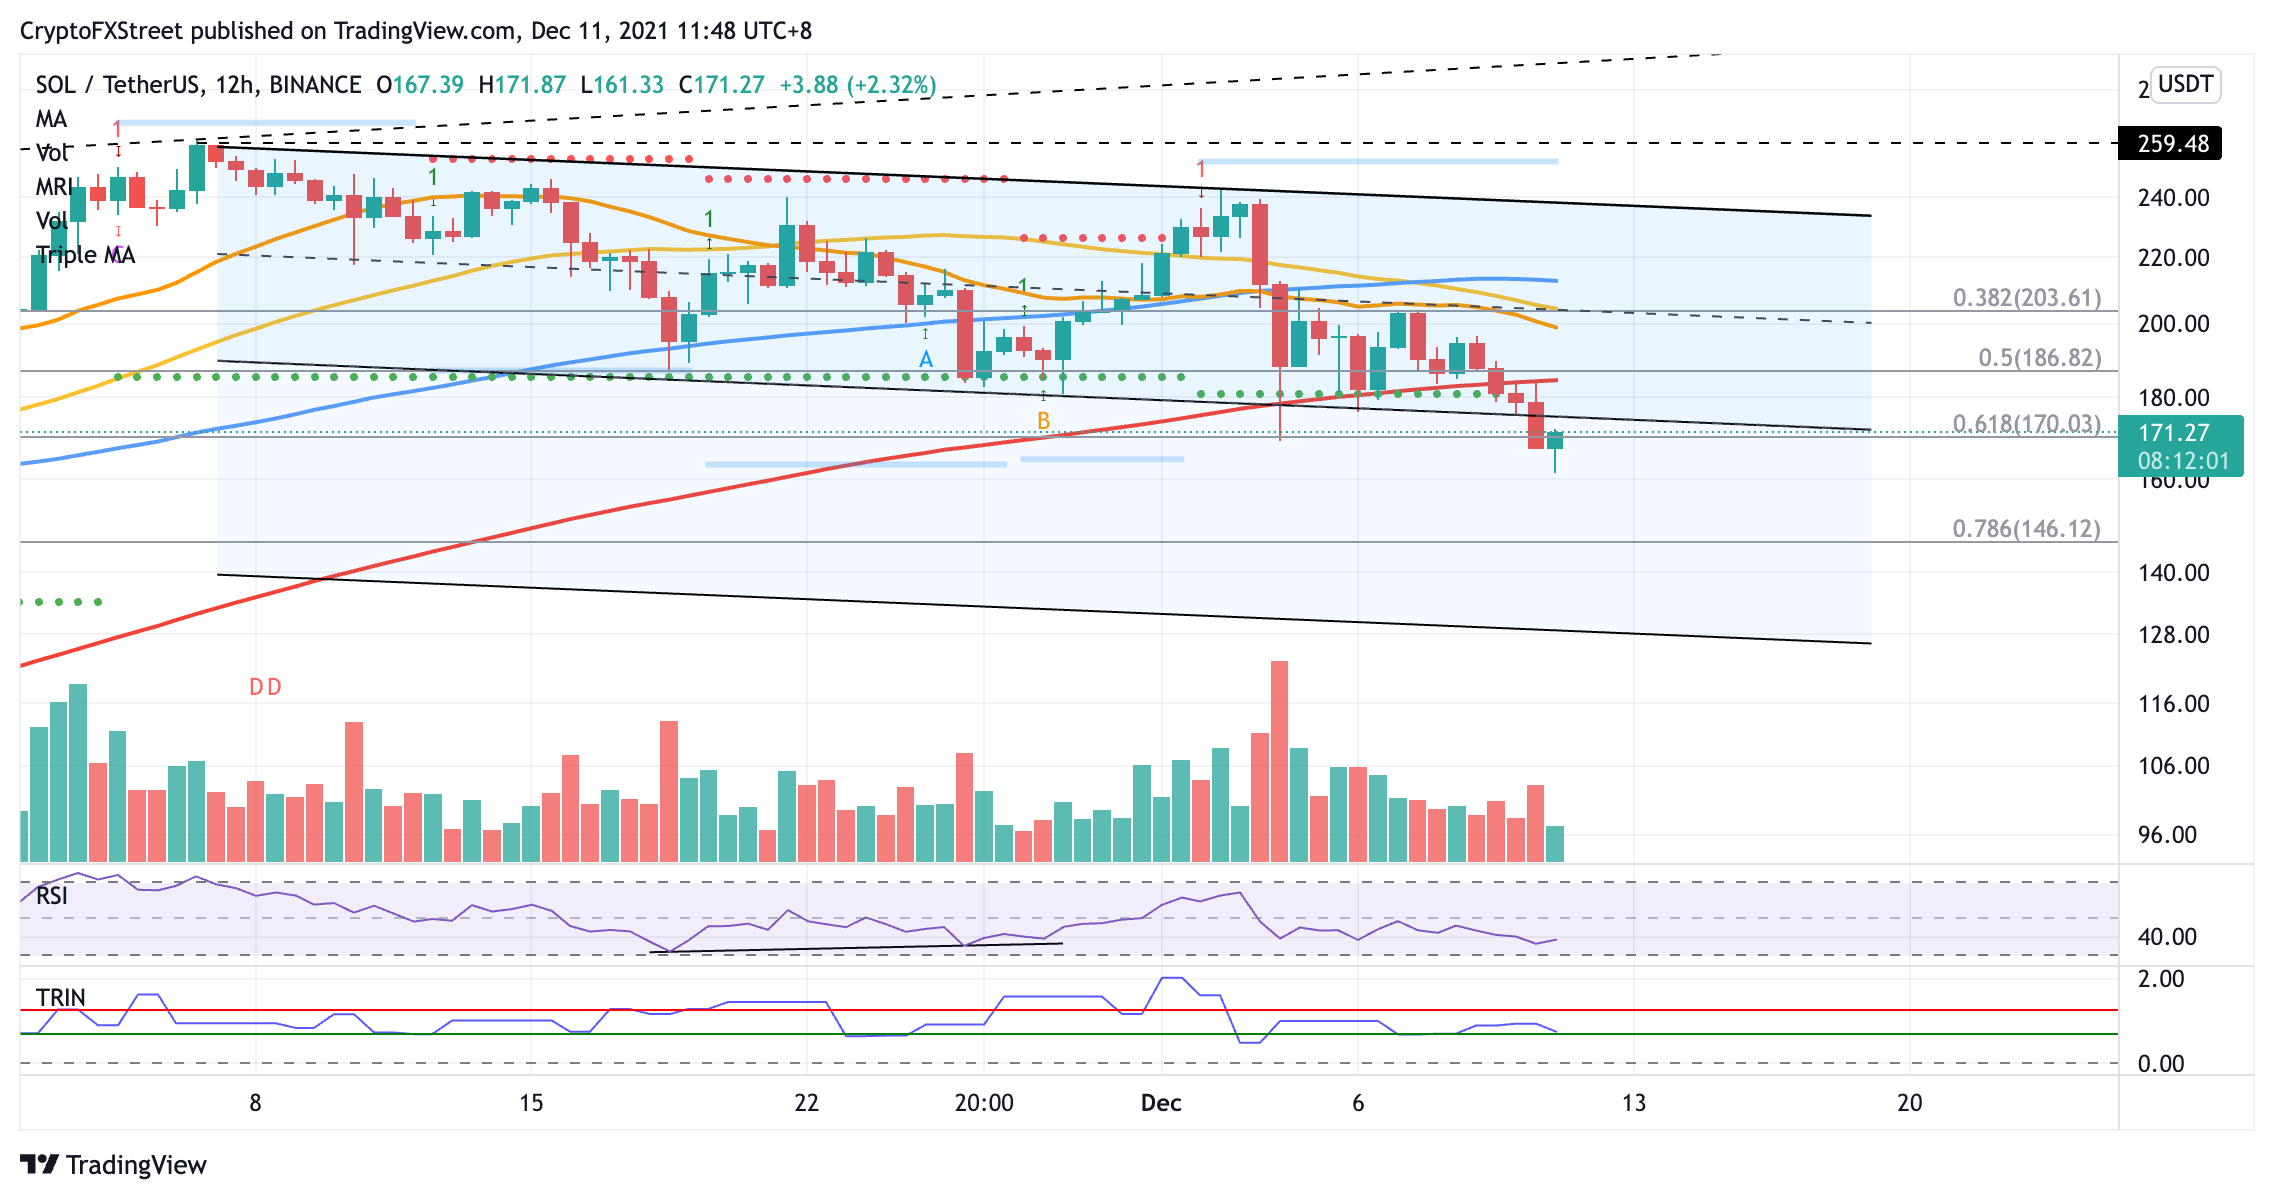
SOL/USDT 12-hour chart
However, if the bulls manage to reverse the period of sluggish performance, the first resistance will appear at the lower boundary of the parallel channel at $174.
Solana price will face additional obstacles ahead, first at the 200 twelve-hour Simple Moving Average (SMA) at $185, then at the 50% retracement level at $186.
Further headwind may appear at the 21 twelve-hour SMA at $198, then at $203, where the middle boundary of the prevailing chart pattern, the 38.2% Fibonacci retracement level and the 50 twelve-hour SMA intersect.
If Solana price manages to slice above the aforementioned hurdle, SOL will then target the 100 twelve-hour hour SMA at $212. Additional buying pressure may incentivize the bulls to set sights on bigger aspirations, targeting the upper boundary of the parallel channel at $236.
Author

Sarah Tran
Independent Analyst
Sarah has closely followed the growth of blockchain technology and its adoption since 2016.


