Solana price could break resistance and hit $144
- Solana price returns to the critical $100 price level.
- Near-term resistance must be watched as it could trigger another swing lower.
- Oscillator conditions warn of further downside pressure.

Solana price has shown some evidence of a strong recovery, holding the $90 value area as a primary support zone and then returning to the $100 level. Bulls have extended their run and targeted the $110 level – but a stiff resistance zone could halt any further upside potential in the near term.
Solana price gets a bullish bounce, but bears are still in control
Solana price has a series of technical factors that may terminate the recent rally. A collection of price levels in the same value area acts as resistance. The Optex Bands and Composite Index oscillators warn of a false move higher in conjunction with those price levels.
If Solana wants to initiate another bull run and return to making new all-time highs, it must first close above the most substantial collection of resistance levels currently near its price. Between the $111 and $120 range are the 38.2% Fibonacci retracement, 100% Fibonacci expansion, weekly Kijun-Sen, and the bottom of the bull flag (represented by a linear regression channel).
Adding further pressure to the price resistance is the existence of hidden bearish divergence between the candlestick chart and the Composite Index. The Solana price chart shows lower highs and lower closes, while the Composite Index shows higher highs. Hidden bearish divergence is only valid if an instrument is already in a downtrend. It warns that the current move is likely to reverse and resume the former downtrend. Additionally, the Optex Bands oscillator's slope is extreme and will hit overbought levels very soon.
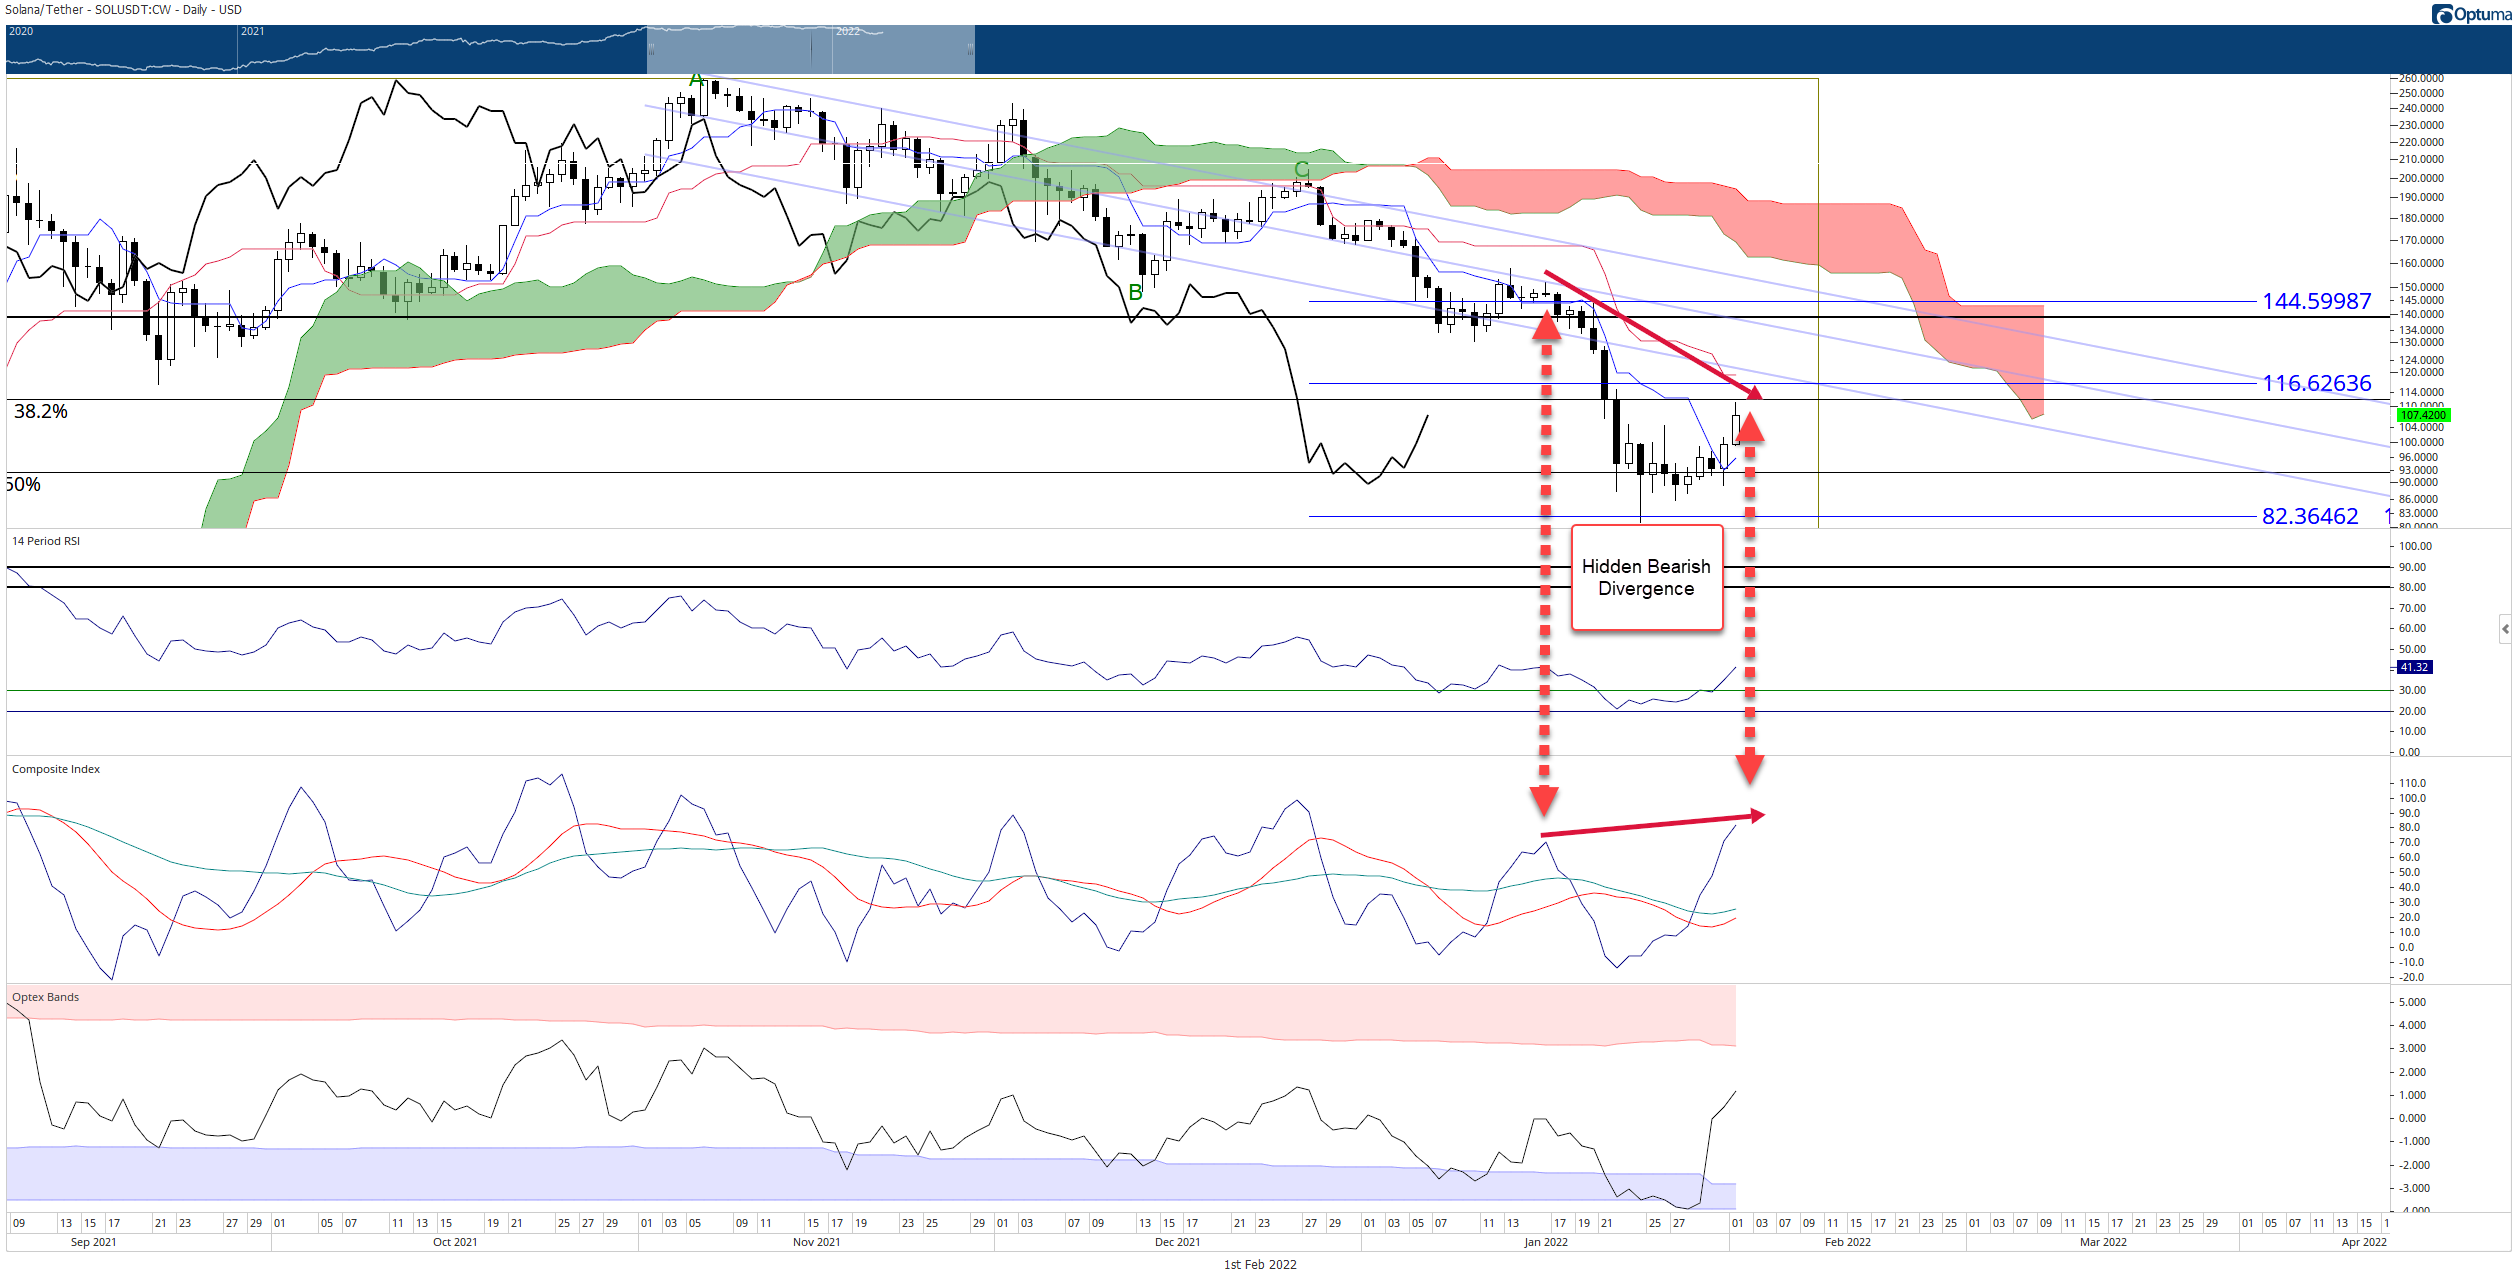
SOL/USDT Daily Ichimoku Kinko Hyo Chart
If bears can stay in control and reject Solana price from moving higher, then it's highly probable that SOL will return to test the 2022 lows and 161.8% Fibonacci expansion near the $80 value area.
However, if bulls come in from the sidelines and can rally Solana to a close at or above $120, further bearish pressure is likely to be invalidated. In that scenario, Solana will have an easy time moving to test the final primary resistance at $144.
Author

Jonathan Morgan
Independent Analyst
Jonathan has been working as an Independent future, forex, and cryptocurrency trader and analyst for 8 years. He also has been writing for the past 5 years.


