Solana price action and on-chain metrics show signs of weakness
- Solana’s price faces rejection around the previously broken ascending trendline, suggesting a downward trend.
- On-chain data add credentials to a bearish outlook on SOL’s long-to-short is below one, decreasing development activity.
- A daily candle stick close above $141.43 would invalidate the bearish thesis.

Solana (SOL) hints at a downward trend as it trades around $132 on Tuesday, following a rejection from the previously broken ascending trendline at $139.80 last week. The bearish outlook is further supported by declining development activity and a long-to-short ratio below one.
Solana price shows signs of weakness
Solana retested but was rejected from the previously broken ascending trendline around $139.80 (drawn by connecting multiple low levels from the end of January) on Friday. It declined 5.3% in the next two days. At the time of writing on Tuesday, it trades at $131.91.
If this trendline and the 50-day EMA at $141.43 continue to hold as resistance, SOL could extend the decline by 9% to its daily support of around $120.91.
This bearish thesis is further supported by the Relative Strength Index (RSI) and the Awesome Oscillator (AO) on the daily chart, which trade below their neutral levels of 50 and zero, respectively. Both momentum indicators suggest that the bears are gaining momentum and indicating a downward trend.
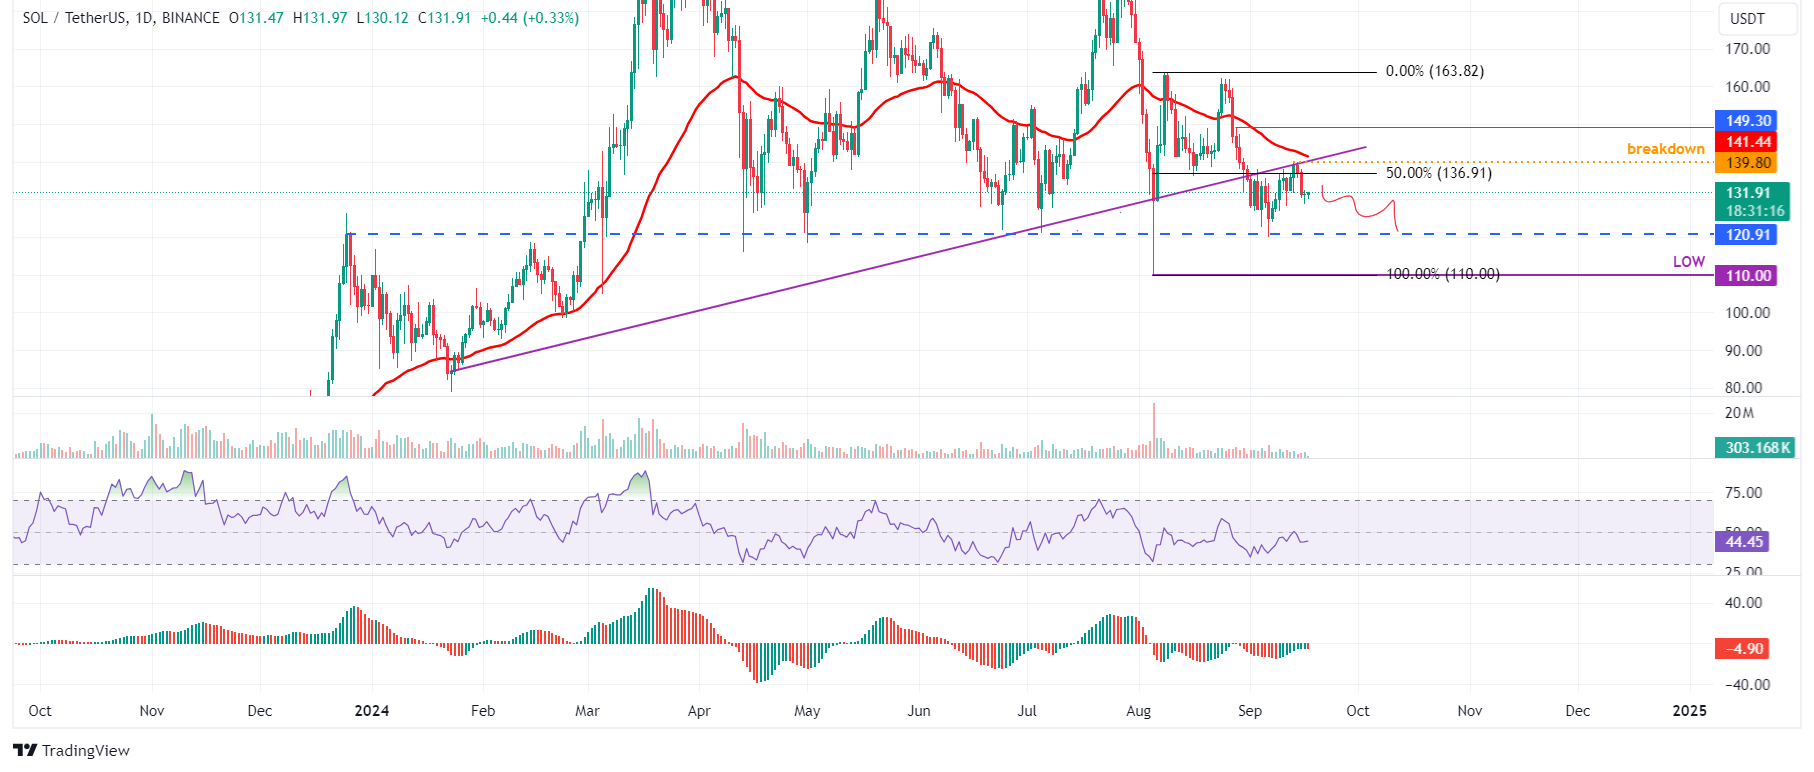
SOL/USDT daily chart
Coinglass data further supports Solana’s bearish outlook. SOL’s long-to-short ratio is at 0.88 and has fallen below one since Friday. This means more traders are betting on the asset’s price to fall.
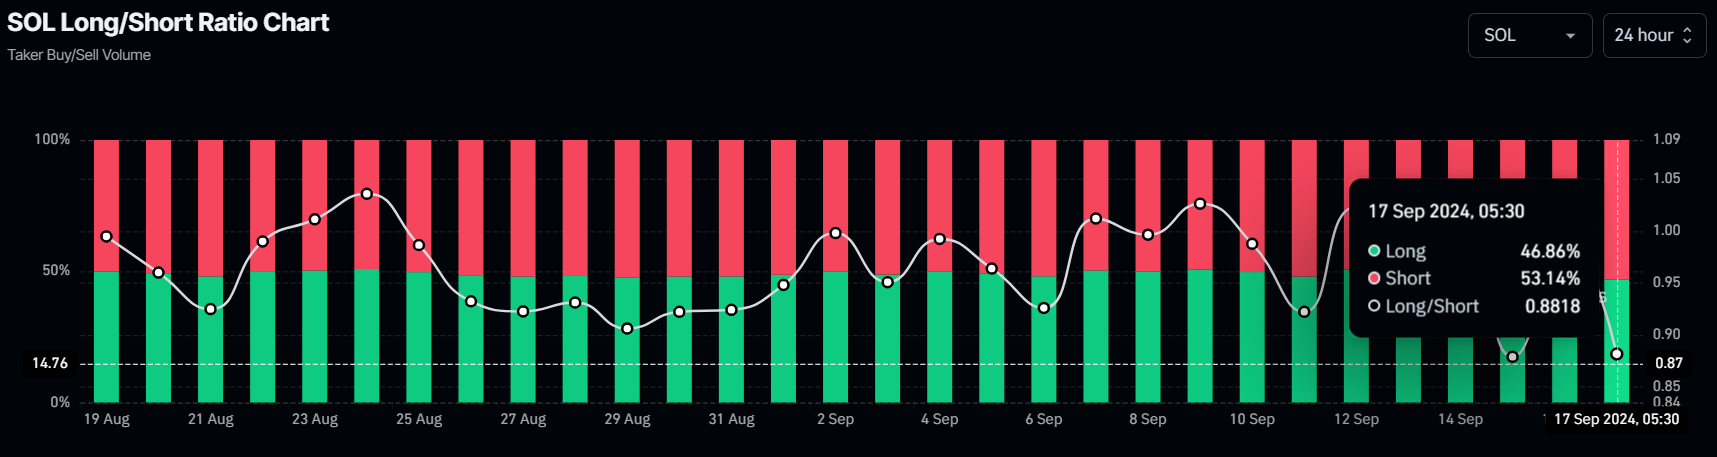
SOL long-to-short ratio chart
Moreover, Santiment’s Development Activity Index aligns with the bearish picture. This metric shows project development activity over time based on several pure development-related events in the project’s public GitHub repository.
In SOL’s case, the index sharply falls from 176.95 on Sunday to 166 on Tuesday. This trend has been falling since early September. This suggests that the low level of development activity on Solana reflects waning confidence in its blockchain projects, which, in turn, undermines investor trust and reinforces the negative market sentiment.
%20[09.38.51,%2017%20Sep,%202024]-638621494234614502.png)
SOL Development Activity chart
Despite the bearish outlook suggested by the technical analysis and on-chain metrics, If Solana’s daily candlestick closes above $141.43, its 50-day EMA would invalidate the bearish thesis by forming a higher high on the daily time frame. Such a development would raise SOL price by 5% to restest its August 28 high of $149.30
Author

Manish Chhetri
FXStreet
Manish Chhetri is a crypto specialist with over four years of experience in the cryptocurrency industry.


