Solana-based DEX Jupiter craters by over 50% barely 24 hours after launch
- Jupiter DEX’s token JUP plunged in market value by 63% in the past 24 hours.
- The crash occurred despite the significant surge in trading volume on Jupiter and Solana.
- Indicators observed on a 24-hour chart showed that SOL market sentiment remains bullish despite recent price declines.

Solana-based Decentralized Exchange (DEX) Jupiter’s (JUP) price has dropped by 63% since it started trading on Wednesday. On-chain data showed that JUP tokens worth over $1 billion have since been traded.
Also read: Solana DEX Jupiter's JUP token to debut with 1.35B circulating supply.
JUP witnesses decline
The Newly launched Jupiter (JUP) token has seen its value plunge by over 60% one day after it became tradeable. With a 63% price drop in the last 24 hours, JUP ranked as the crypto asset with the most losses during that period, according to data from CoinMarketCap.
At press time, the altcoin traded at $0.57. Since it launched on Wednesday, JUP tokens worth $1.2 billion have been traded, according to data from crypto intelligence tracker Santiment.
 [11.47.49, 01 Feb, 2024]-638423813314198085.png)
JUP trading volume
Due to this, the trading volume on the Solana-based decentralized exchange (DEX) totaled $1.28 billion, surpassing Uniswap’s $857 million, according to data from CoinGecko.
Solana benefits from Jupiter’s growth
As a result of the spike in activity on Jupiter, its home chain Solana has also seen its user activity surge in the past 24 hours. The trading volume on the Layer 1 (L1) network was $1.5 billion on Wednesday, marking a 75% increase from the $853 million recorded the day before.
According to data from DefiLlama, Wednesday’s figure also represented Solana’s highest single-day trading volume since December 22.
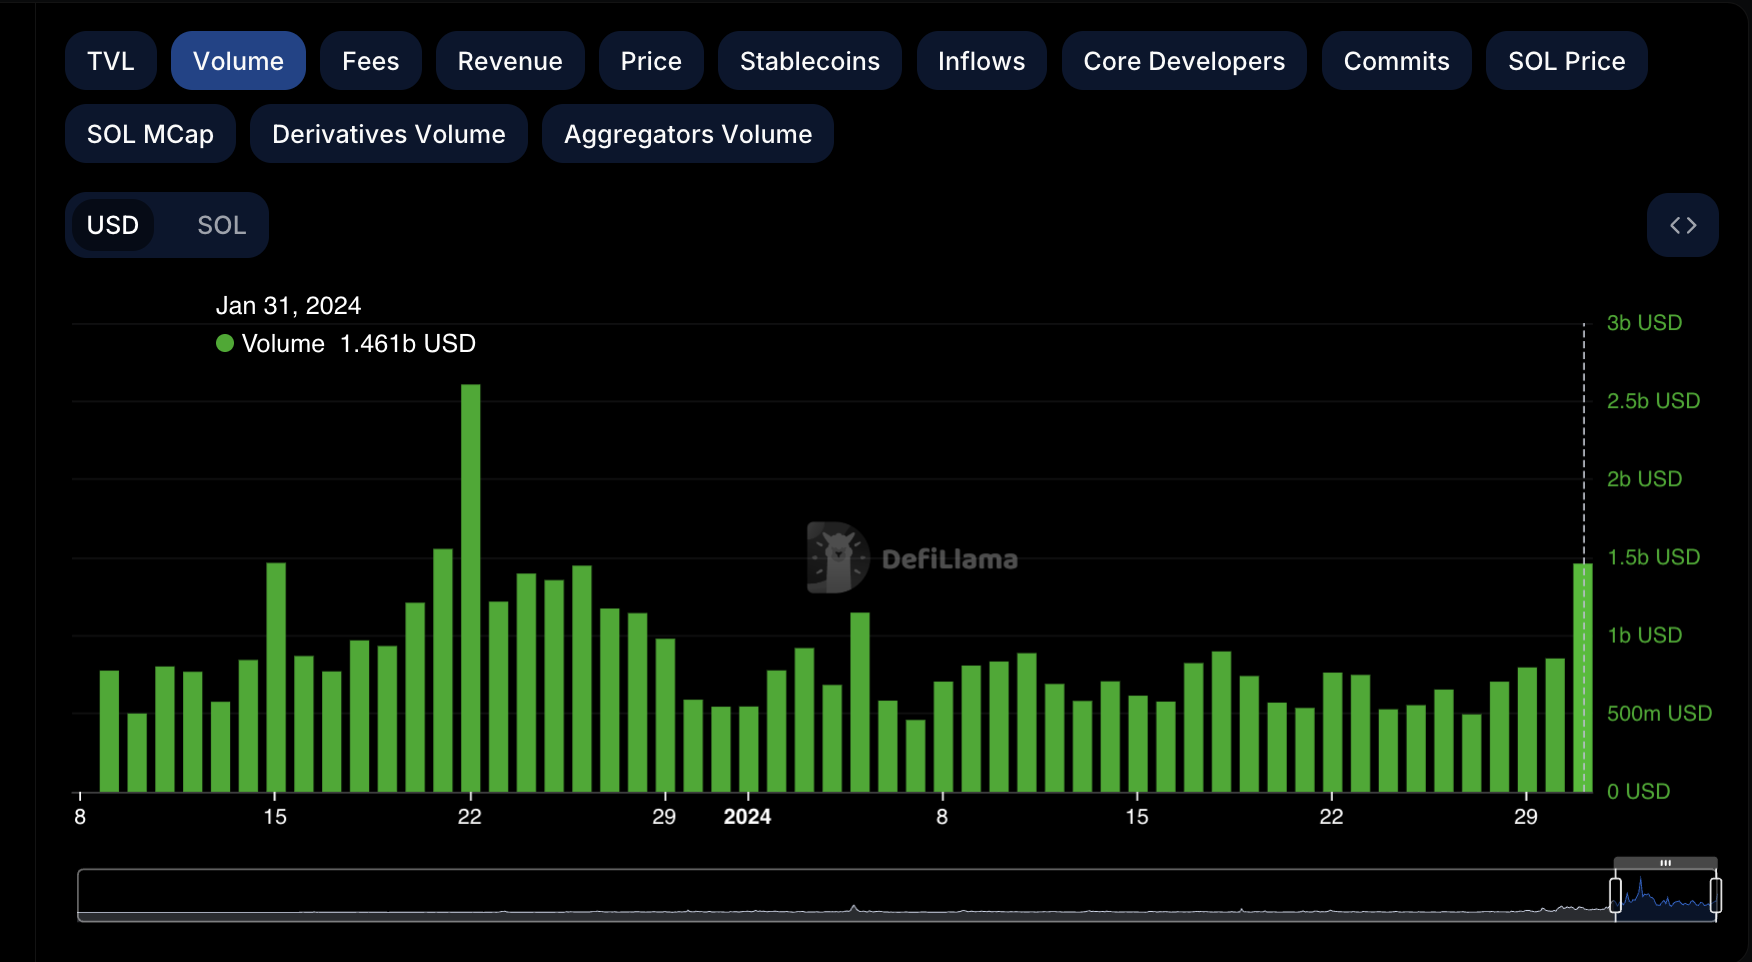
Solana Trading Volume
This caused daily transaction fees on Solana to climb to their highest level in the last year. Data from Token Terminal showed that users paid a cumulative of $1.2 million in fees on Solana on Wednesday.
All of these, however, failed to impact SOL’s price in the past 24 hours. At press time, the L1 coin exchanged hands at $95.80, a 5% price decline in the last 24 hours. Although SOL has shed almost 10% of its value in the last month, key indicators observed on a daily chart show that market sentiment remains arguably bullish.
For example, the coin’s Moving Average Convergence/Divergence (MACD) line (blue) initiated a crossover above the signal line (orange) on January 28. This caused it to rally above the zero line to return a value of 0.87 at press time. When an asset’s MACD line moves in this manner, it suggests that the asset may have entered a bullish cycle where buying activity outpaces coin sell-offs.
A CMF value above zero showed that coin holders favored accumulation over distribution.
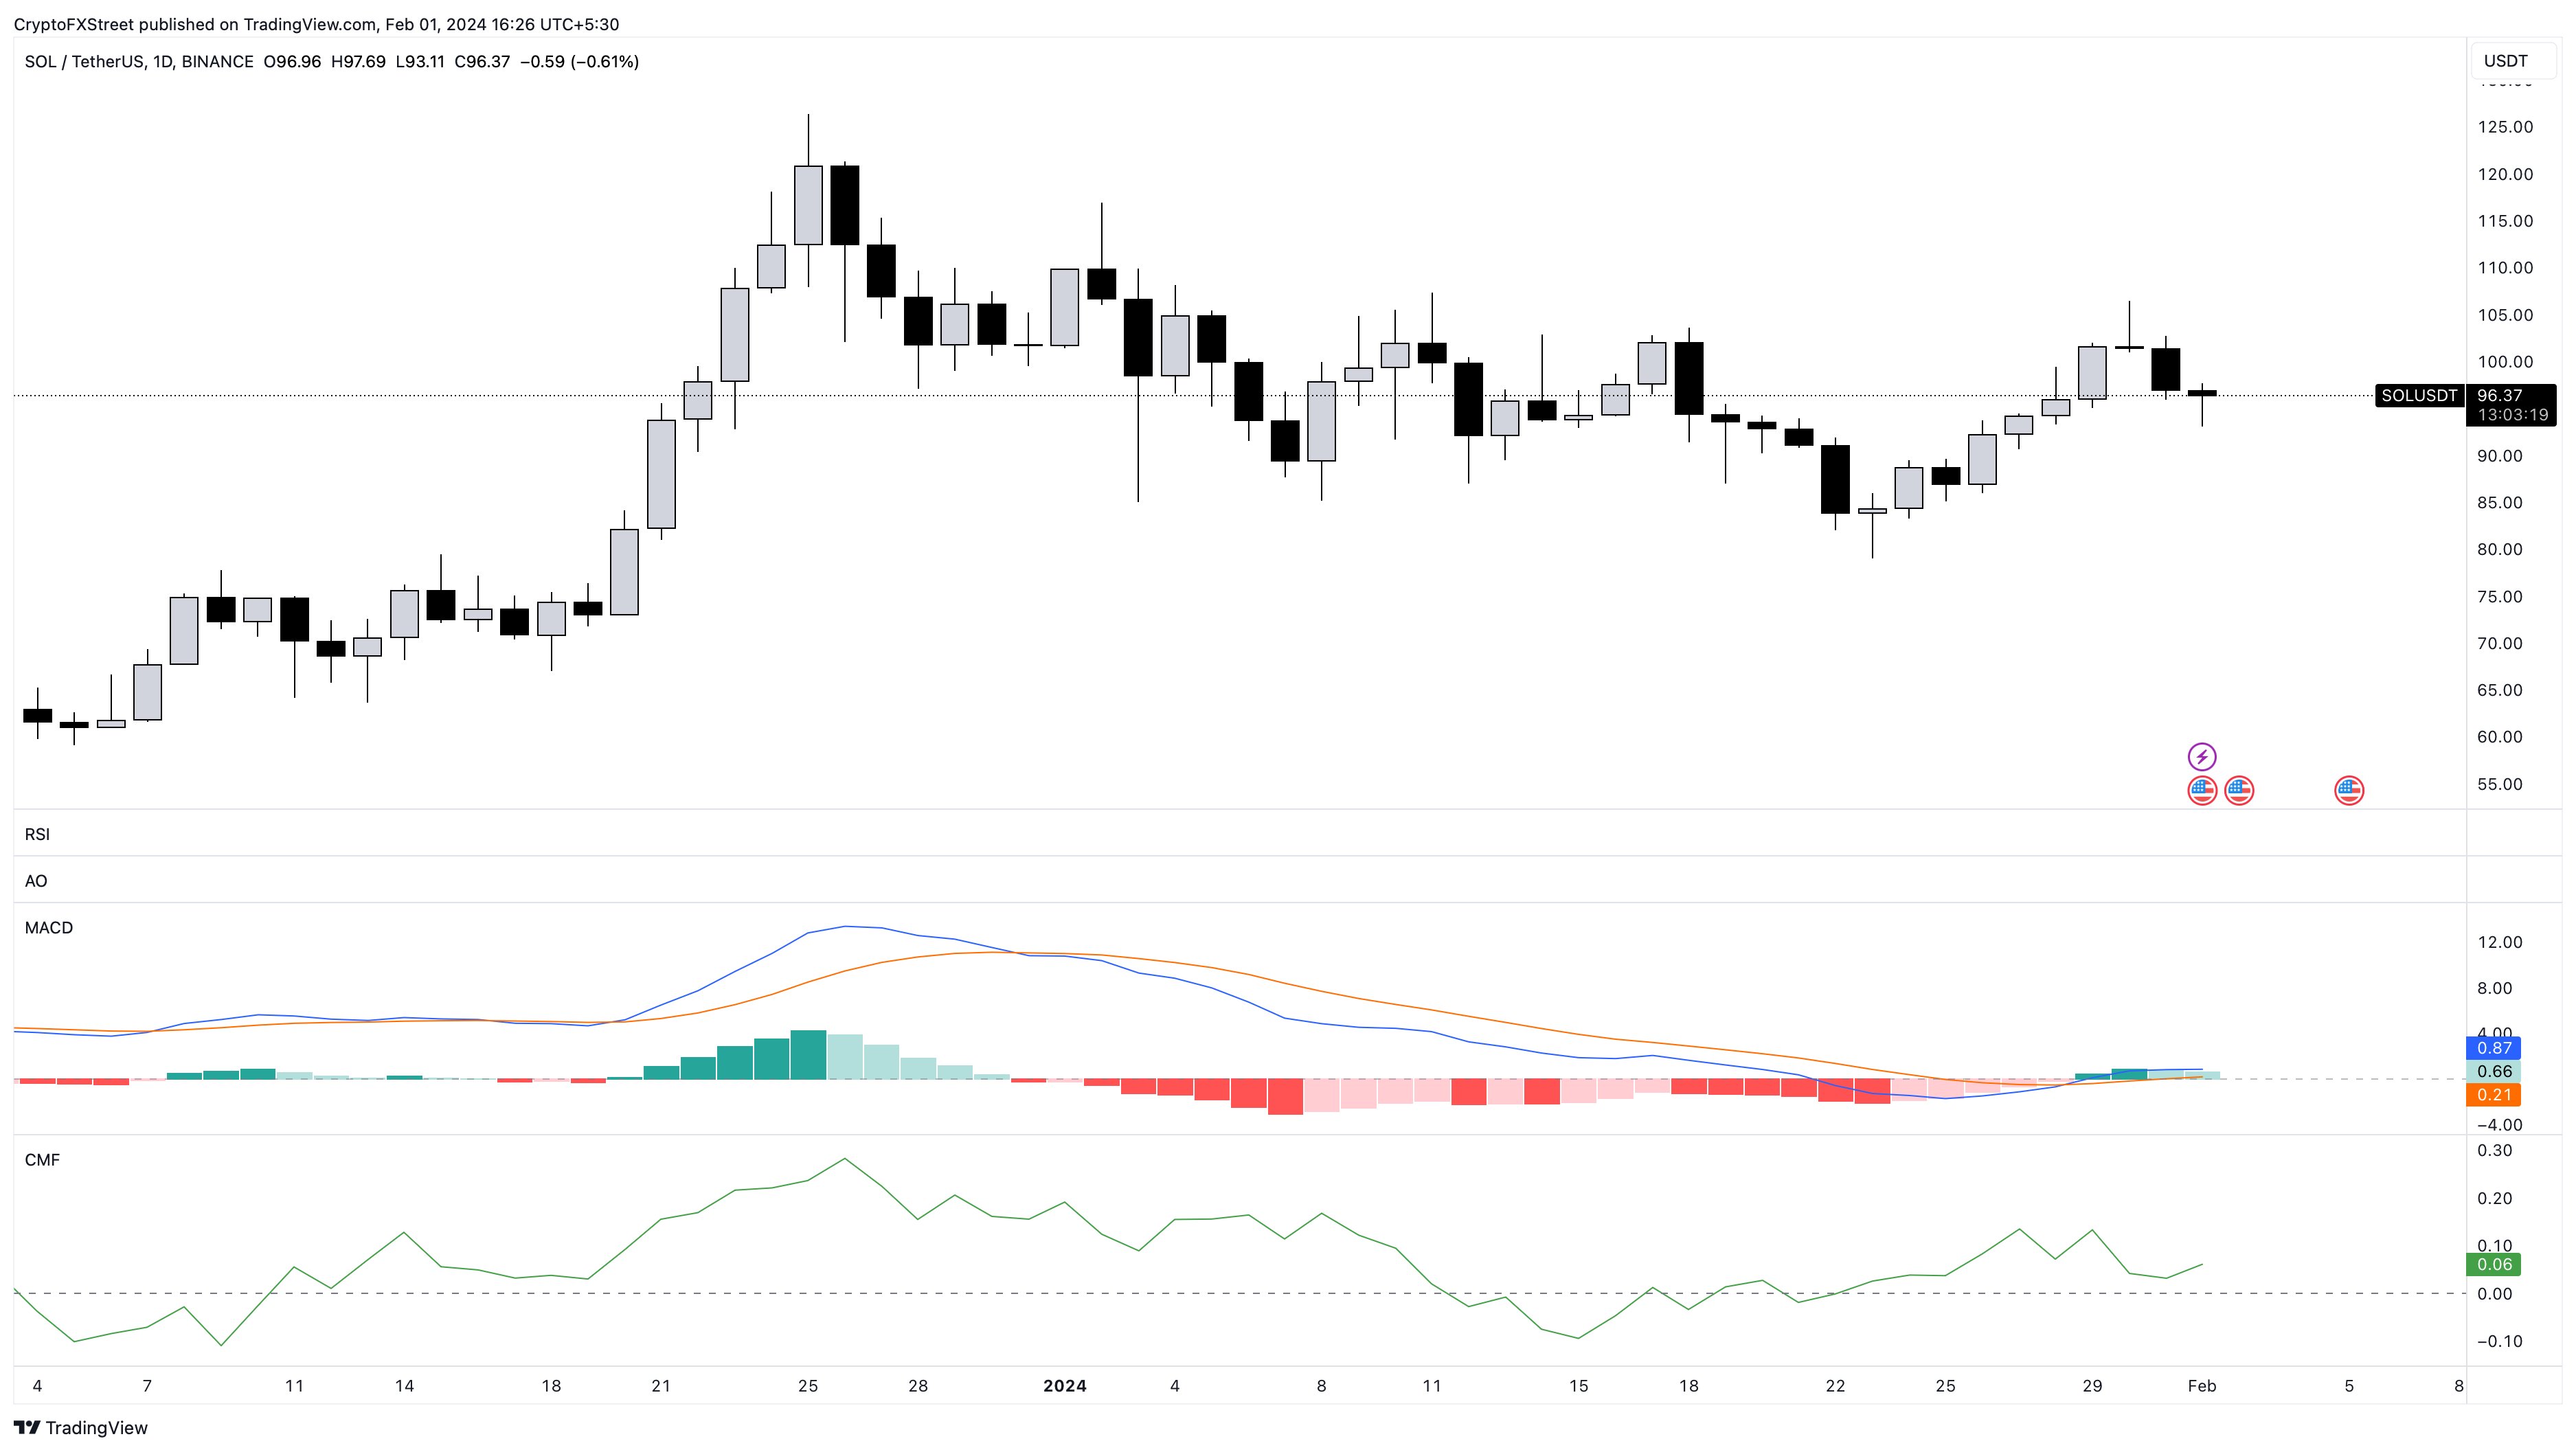
SOL/USDT 1-day chart
As JUP sell-offs intensify and the hype around the DEX cools, it might experience a pullback in trading volume. This may result in a decline in daily trading volume on Solana as well.


