SOL price could find inflection here as Solana Saga phone presale orders reach 40,000
- Solana price breached the $89.02 support in what appears to be a calculated liquidity grab.
- SOL could find inflection here, kickstarting an uptrend as interest in Solana Saga phones grows.
- A break and close below the $80.00 psychological level could invalidate the bullish thesis.

Solana (SOL) price lost the support due to the confines of the ascending parallel channel on January 18, triggering a cascade of losses for SOL holders and culminating in the Layer 1 (L1) token breaching a critical support. The outlook may be due to change soon amid growing optimism in the network.
Also Read: SILLY Solana meme coin rallies 40% as Chinese New Year narrative kicks in
Solana Saga phones presale orders reach 40,000
Recent reports indicate that Solana Saga phones pre-sale orders, due for delivery in 2025, have reached 40,000. The second smartphone series, like the first, is the brainchild of Solana Mobile. The first Saga series recorded massive sales, going as high as selling out in the US market.
JUST IN: Solana SAGA phone pre-sale orders reaches 40,000, count is still increasing. pic.twitter.com/NLaBhxAt3R
— SolanaFloor | Powered by Step Finance (@SolanaFloor) January 22, 2024
Solana Mobile looks to offer Saga’s basic features and built-in crypto wallet at more affordable rates. The forerunner, Saga, first debuted at a price of $1,000 but was reduced to $599, with the phone’s successor likely to take things up a notch after the predecessor featured an integrated crypto wallet, customized Android software and an app store for Web3 applications. As reported, the launch of the second crypto smartphone is likely to catalyze a recovery in Solana price.
Solana price likely finds an inflection point
After nearly 10% in losses, since the Solana price slipped below the support offered by the lower boundary of the ascending trendline, the L1 token has likely found inflection in what appears to be a liquidity grab, collecting the buy-side liquidity (BSL) indicated in the daily chart.
A liquidity grab is different from a liquidity sweep. The latter is a deliberate move to capture available liquidity and has potential for strategic gains. A liquidity grab on the other hand is a sudden intentional or unintentional market movement due to large trades. Sudden spikes in trading volume define it and appear as sharp price movements on the chart without apparent news triggers.
Santiment data corroborates this, showing volume rising by 78%, from 1.23 billion to 2.19 billion between January 20 and 22. This was despite crashing prices.
 [22.45.58, 22 Jan, 2024]-638415514765470604.png)
SOL Santiment: Volume
If buyers seize the opportunity to buy the dip, seizing the liquidity grab, the Solana price could recover, flipping the downtrend line into support. Enhanced buying pressure could set the altcoin into the confines of the ascending channel. A break and close above the midline of this channel would usher SOL into the supply zone between $107.92 and $121.19. A break and close above the midline of this order block at $114.76 would confirm the continuation of the uptrend.
In a highly bullish case, Solana price could shatter past the supply zone, flipping it into a bullish breaker and confirm the move by clearing the range high with a higher high above $128.36.
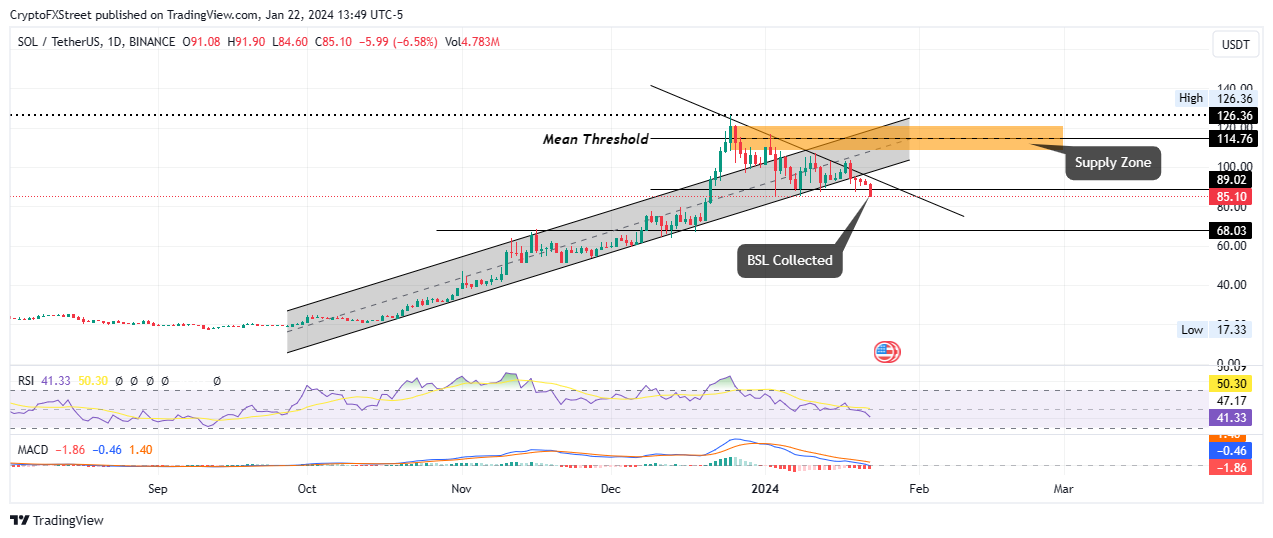
SOL/USDT 1-day chart
Conversely, if selling pressure increases, Solana price could extend the fall. A break and close below the $80.00 psychological level would invalidate the bullish thesis. In a dire case, the slump could send SOL to the $68.03 support, standing nearly 20% below current levels.
With the Relative Strength Index (RSI) still southbound, momentum is still falling. This is accentuated by the Moving Average Convergence Divergence (MACD), which despite being in negative territory is still moving below the signal line (orange band) with red histogram bars. These indicators favor the downside.
Author

Lockridge Okoth
FXStreet
Lockridge is a believer in the transformative power of crypto and the blockchain industry.


