Shiba Inu Price Prediction: SHIB steadies, as maximum downside limited to 10%
- Shiba Inu price inches closer to testing the May 19 low after primary moving average fails to resist selling.
- SHIB volume not reflecting a mass exodus for the exits, suggesting that selling is compelled by broader market weakness.
- Symmetrical triangle apex remains a critical resistance level for any reemergence of buying pressure.

Shiba Inu price reversed the 27% gain accompanying the June 15 announcement that SHIB would be listed on the Coinbase Pro in just three days, putting it in a delicate technical position. That resolved to the downside today. Now the rookie cryptocurrency may be poised to test the June 12 low if the weakness in the cryptocurrency complex persists.
Shiba Inu price sowing seeds of doubt among the meme token faithful
From the June 11 low to the June 15 high, Shiba Inu price successfully tested the May 19 low of $0.00000607, shattered a descending channel, overcame exceptional resistance at $0.00000770, briefly surpassed the apex of a multi-week symmetrical triangle at $0.00000888 and tagged the 200 four-hour SMA at $0.00000978. Furthermore, SHIB climbed approximately 80%, thereby shaking off skepticism dictated by the previous bearish price structure.
Since, Shiba Inu price has declined almost 35% from the June 15 high, leaving behind the symmetrical triangle apex and the temporary support discovered at the 50 four-hour simple moving average (SMA). However, the disappointing reversal has released the overbought condition displayed by the four-hour Relative Strength Index (RSI), improving the conditions for a new, spirited SHIB rally higher should the cryptocurrency market regain a measure of support.
Considering the bearish SHIB price action over the weekend and today, investors’ trade direction should be cautious, with an eye on the May 19 low of $0.00000607, followed by the June low of $0.00000550 as possible support levels. The levels represent losses of 10% and 20%, respectively.
If both SHIB price levels fail, market speculators should acknowledge the next support at the 138.2% Fibonacci downside extension of the May 19 bounce at $0.00000354, equating to a 48% decline from the current Shiba Inu price.
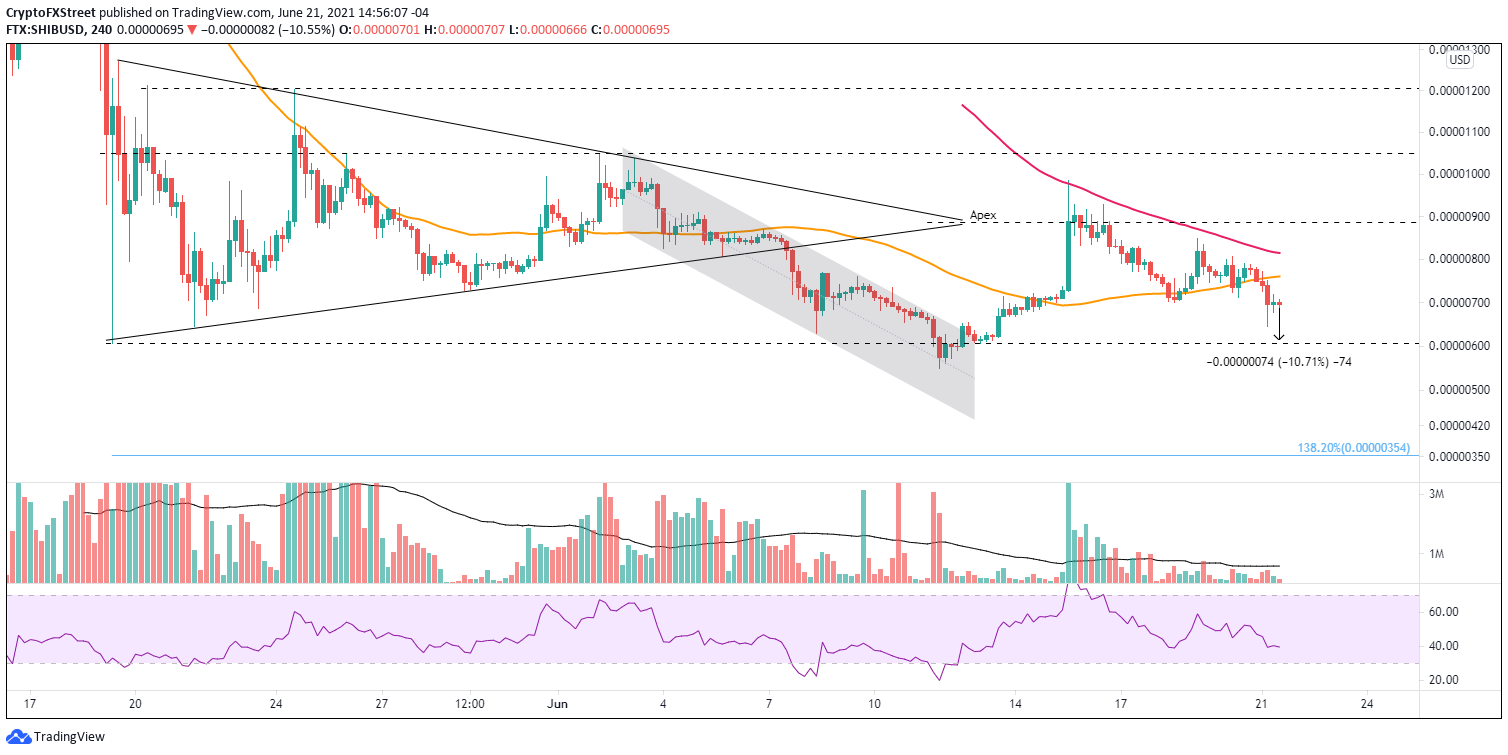
SHIB/USD 4-hour chart
On the upside, Shiba Inu price needs to close above the 50 four-hour moving average at $0.00000760, followed by the 200 four-hour moving average at $0.00000815. The path to a meaningful SHIB rally also includes the triangle’s apex at $0.000000888, representing a 30% gain from the current price.
Shiba Inu price feels the weight of the broader market and the earlier Coinbase Pro delay, but it still holds the correction low of $0.00000550, which not all altcoins can claim today. Moreover, the turnaround in SHIB has not pulled the 50 four-hour SMA lower gain. Instead, the moving average is trending higher and on pace to cross the 200 four-hour SMA in a couple of days, unless the current weakness evolves into a deeper, more complex bottoming process. Lastly, the volume profile during this new corrective process has been contracting, suggesting that most weak holders have exited their positions.
Author

Sheldon McIntyre, CMT
Independent Analyst
Sheldon has 24 years of investment experience holding various positions in companies based in the United States and Chile. His core competencies include BRIC and G-10 equity markets, swing and position trading and technical analysis.



