- Shiba Inu price, despite a 13.57% decline, still has not invalidated the double bottom bullish reversal pattern.
- SHIB is treading above the stop loss of $0.0000094, with minor hints of recovery.
- A 5% increase from the current price would result in an invalidation of the bearish thesis and a bullish reversal.
Shiba Inu price has yet to note a comeback, and the flow of funds into Bitcoin following the spot Bitcoin ETF approval has made the same a lot more difficult. Nevertheless, SHIB has an opportunity to note a reversal since it has not completely invalidated the bullish thesis.
Shiba Inu price has a shot at rally
Shiba Inu price fell by a little over 13% in the last couple of days but is still hanging above the support line at `094. This price level also marks the stop loss of the double bottom pattern observed over the nine months. This macro bullish reversal pattern dictates a probability of a potential 34% rally based on the target achieved using the pattern which is marked at `138.
The double bottom pattern, also known as the 'W' pattern, is formed when an asset hits two distinct lows at the same level on separate trading sessions.
The support level is identified as the point at which the price of an asset drops twice. In the context of SHIB, this support level is noted at $0.0000066. SHIB experienced a rebound from this level in early June and again in the last week of October.
To deduce potential growth, one can analyze the double bottom pattern by assessing its height. The anticipated increase above the breakout level, referred to as the neckline, is considered the projected growth. For Shiba Inu, the breakout level is set at $0.0000102, and the pattern's height positions the target at $0.0000138. This represents an approximate 35% increase above the breakout level. This target is set at about 41% above the current trading price of `097.
If the breakout level is successfully tested as a support floor, the bullish pattern will be successful, and the chances of a long-term rally are likely.
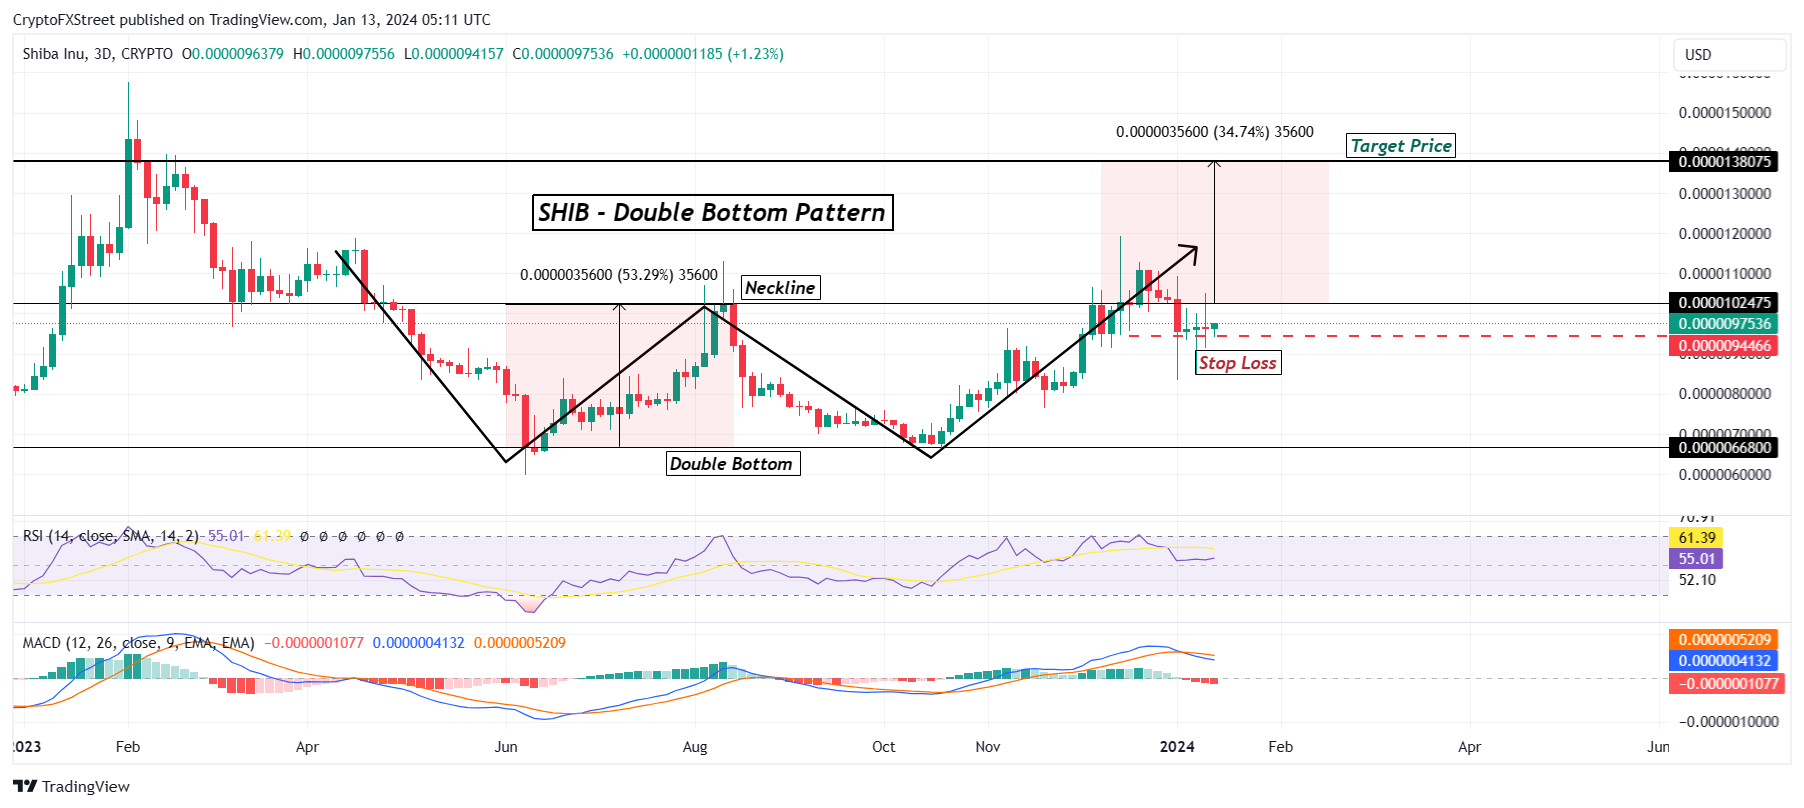
SHIB/USD 3-day chart
However, if SHIB falls through the stop loss level, the double bottom pattern would fail, invalidating the bullish thesis and sending the meme coin to lows below `090.
The price indicators Relative Strength Index (RSI) and Moving Average Convergence Divergence (MACD) are sending out mixed signals at the moment. This means that Shiba Inu price could sustain above the stop loss price point for a while, and if the investors' funds once again begin flowing into the altcoins, SHIB could have a shot at a recovery rally.
Information on these pages contains forward-looking statements that involve risks and uncertainties. Markets and instruments profiled on this page are for informational purposes only and should not in any way come across as a recommendation to buy or sell in these assets. You should do your own thorough research before making any investment decisions. FXStreet does not in any way guarantee that this information is free from mistakes, errors, or material misstatements. It also does not guarantee that this information is of a timely nature. Investing in Open Markets involves a great deal of risk, including the loss of all or a portion of your investment, as well as emotional distress. All risks, losses and costs associated with investing, including total loss of principal, are your responsibility. The views and opinions expressed in this article are those of the authors and do not necessarily reflect the official policy or position of FXStreet nor its advertisers. The author will not be held responsible for information that is found at the end of links posted on this page.
If not otherwise explicitly mentioned in the body of the article, at the time of writing, the author has no position in any stock mentioned in this article and no business relationship with any company mentioned. The author has not received compensation for writing this article, other than from FXStreet.
FXStreet and the author do not provide personalized recommendations. The author makes no representations as to the accuracy, completeness, or suitability of this information. FXStreet and the author will not be liable for any errors, omissions or any losses, injuries or damages arising from this information and its display or use. Errors and omissions excepted.
The author and FXStreet are not registered investment advisors and nothing in this article is intended to be investment advice.
Recommended Content
Editors’ Picks

Why Solana, XRP, Dogecoin and BNB are crashing?
Solana (SOL), XRP, Dogecoin (DOGE) and Binance Coin (BNB) decline on Tuesday. Top altcoins ranked by market capitalization are in a downward trend, even though Bitcoin (BTC) continues to consolidate around the $95,000 level.

Bitcoin Price Forecast: BTC consolidates as options market awaits policy clarity
Bitcoin (BTC) has been consolidating between $94,000 and $100,000 for nearly two weeks, with reports from Bitfinex indicating increased macro-correlation and maturity as a risk asset.

Real-World Assets outperform the AI sector in the crypto market over the past month
Real-World Assets (RWAs) outperformed the Artificial Intelligence (AI) sector in the crypto market over the past month, with a weighted average gain of 15.6% in January.

Storj Price Forecast: Bulls aiming for double-digit gains
Storj (STORJ), an open-source platform that leverages the blockchain to provide end-to-end encrypted cloud storage services, continues to trade higher by 4.4%, around $0.39 on Tuesday after rallying 5% the previous day.

Bitcoin: BTC consolidates before a big move
Bitcoin price has been consolidating between $94,000 and $100,000 for the last ten days. US Bitcoin spot ETF data recorded a total net outflow of $650.80 million until Thursday.

The Best Brokers of the Year
SPONSORED Explore top-quality choices worldwide and locally. Compare key features like spreads, leverage, and platforms. Find the right broker for your needs, whether trading CFDs, Forex pairs like EUR/USD, or commodities like Gold.