Shiba Inu holders take profits, pushing SHIB price nearly 45% below its 2024 peak
- Shiba Inu holders have realized gains on their SHIB holdings for nearly two weeks, until March 18.
- SHIB price has fallen by a sharp 45% from its year-to-date peak of $0.00004567.
- Shiba Inu price could face another 30% drawdown before recovering.
Shiba Inu (SHIB) price declined to an intraday low of $0.00002366 on Wednesday, a.nearly 45% drawdown from its year-to-date peak. The recent Bitcoin price correction has resulted in a drop in several other cryptocurrency assets, hitting altcoins and meme coins as well.
Beyond the broader market correction, SHIB holders have consistently taken profits for nearly two weeks, between March 4 and 18, a factor that has likely contributed to the sharp correction.
Also read: Shiba Inu Price Prediction: SHIB loses top 10 position to AVAX
Shiba Inu price crashes in crypto market correction
Shiba Inu price is down to $0.00002531 at the time of writing. The meme coin suffered a steep correction after hitting its year-to-date peak of $0.00004567 on March 5. SHIB could continue its decline, according to on-chain metrics and technical indicators.
The Network Realized Profit/Loss metric, which has recorded positive spikes in the last two weeks, shows consistent profit-taking by SHIB holders. This has happened alongside the asset’s price correction.
 [16.05.43, 20 Mar, 2024]-638465365704554582.png)
Network Realized Profit/Loss. Source: Santiment
Moreover, Shiba Inu has observed a decline in address activity. Both the number of active addresses and the Network Growth (or the number of new addresses) are in a downward trend, signaling a decline in interest from market participants.
 [17.07.35, 20 Mar, 2024]-638465366007508518.png)
Shiba Inu Active Addresses and Network Growth. Source: Santiment
Shiba Inu price could see another 30% drawdown
SHIB/USDT is trading at $0.00002531 at the time of writing, down45% from its year-to-date high of $0.00004567. The meme coin is currently in a downward trend and technical indicators such as the Moving Average Convergence/Divergence (MACD) favor more losses.
The red bars below the zero line on the MACD generally indicate that bearish momentum is increasing. Meanwhile, the Relative Strength Index (RSI) is close to the neutral zone at 50.66, signaling indecisiveness among investors.
There is a Fair Value Gap (FVG) on SHIB/USDT monthly chart between $0.00000997 and $0.00002136. Shiba Inu price could collect liquidity in this range before a rebound.
SHIB price is likely to find support at $0.00001821, the 23.6% Fibonacci retracement level, followed by the midpoint of the FVG at 0.00001565.
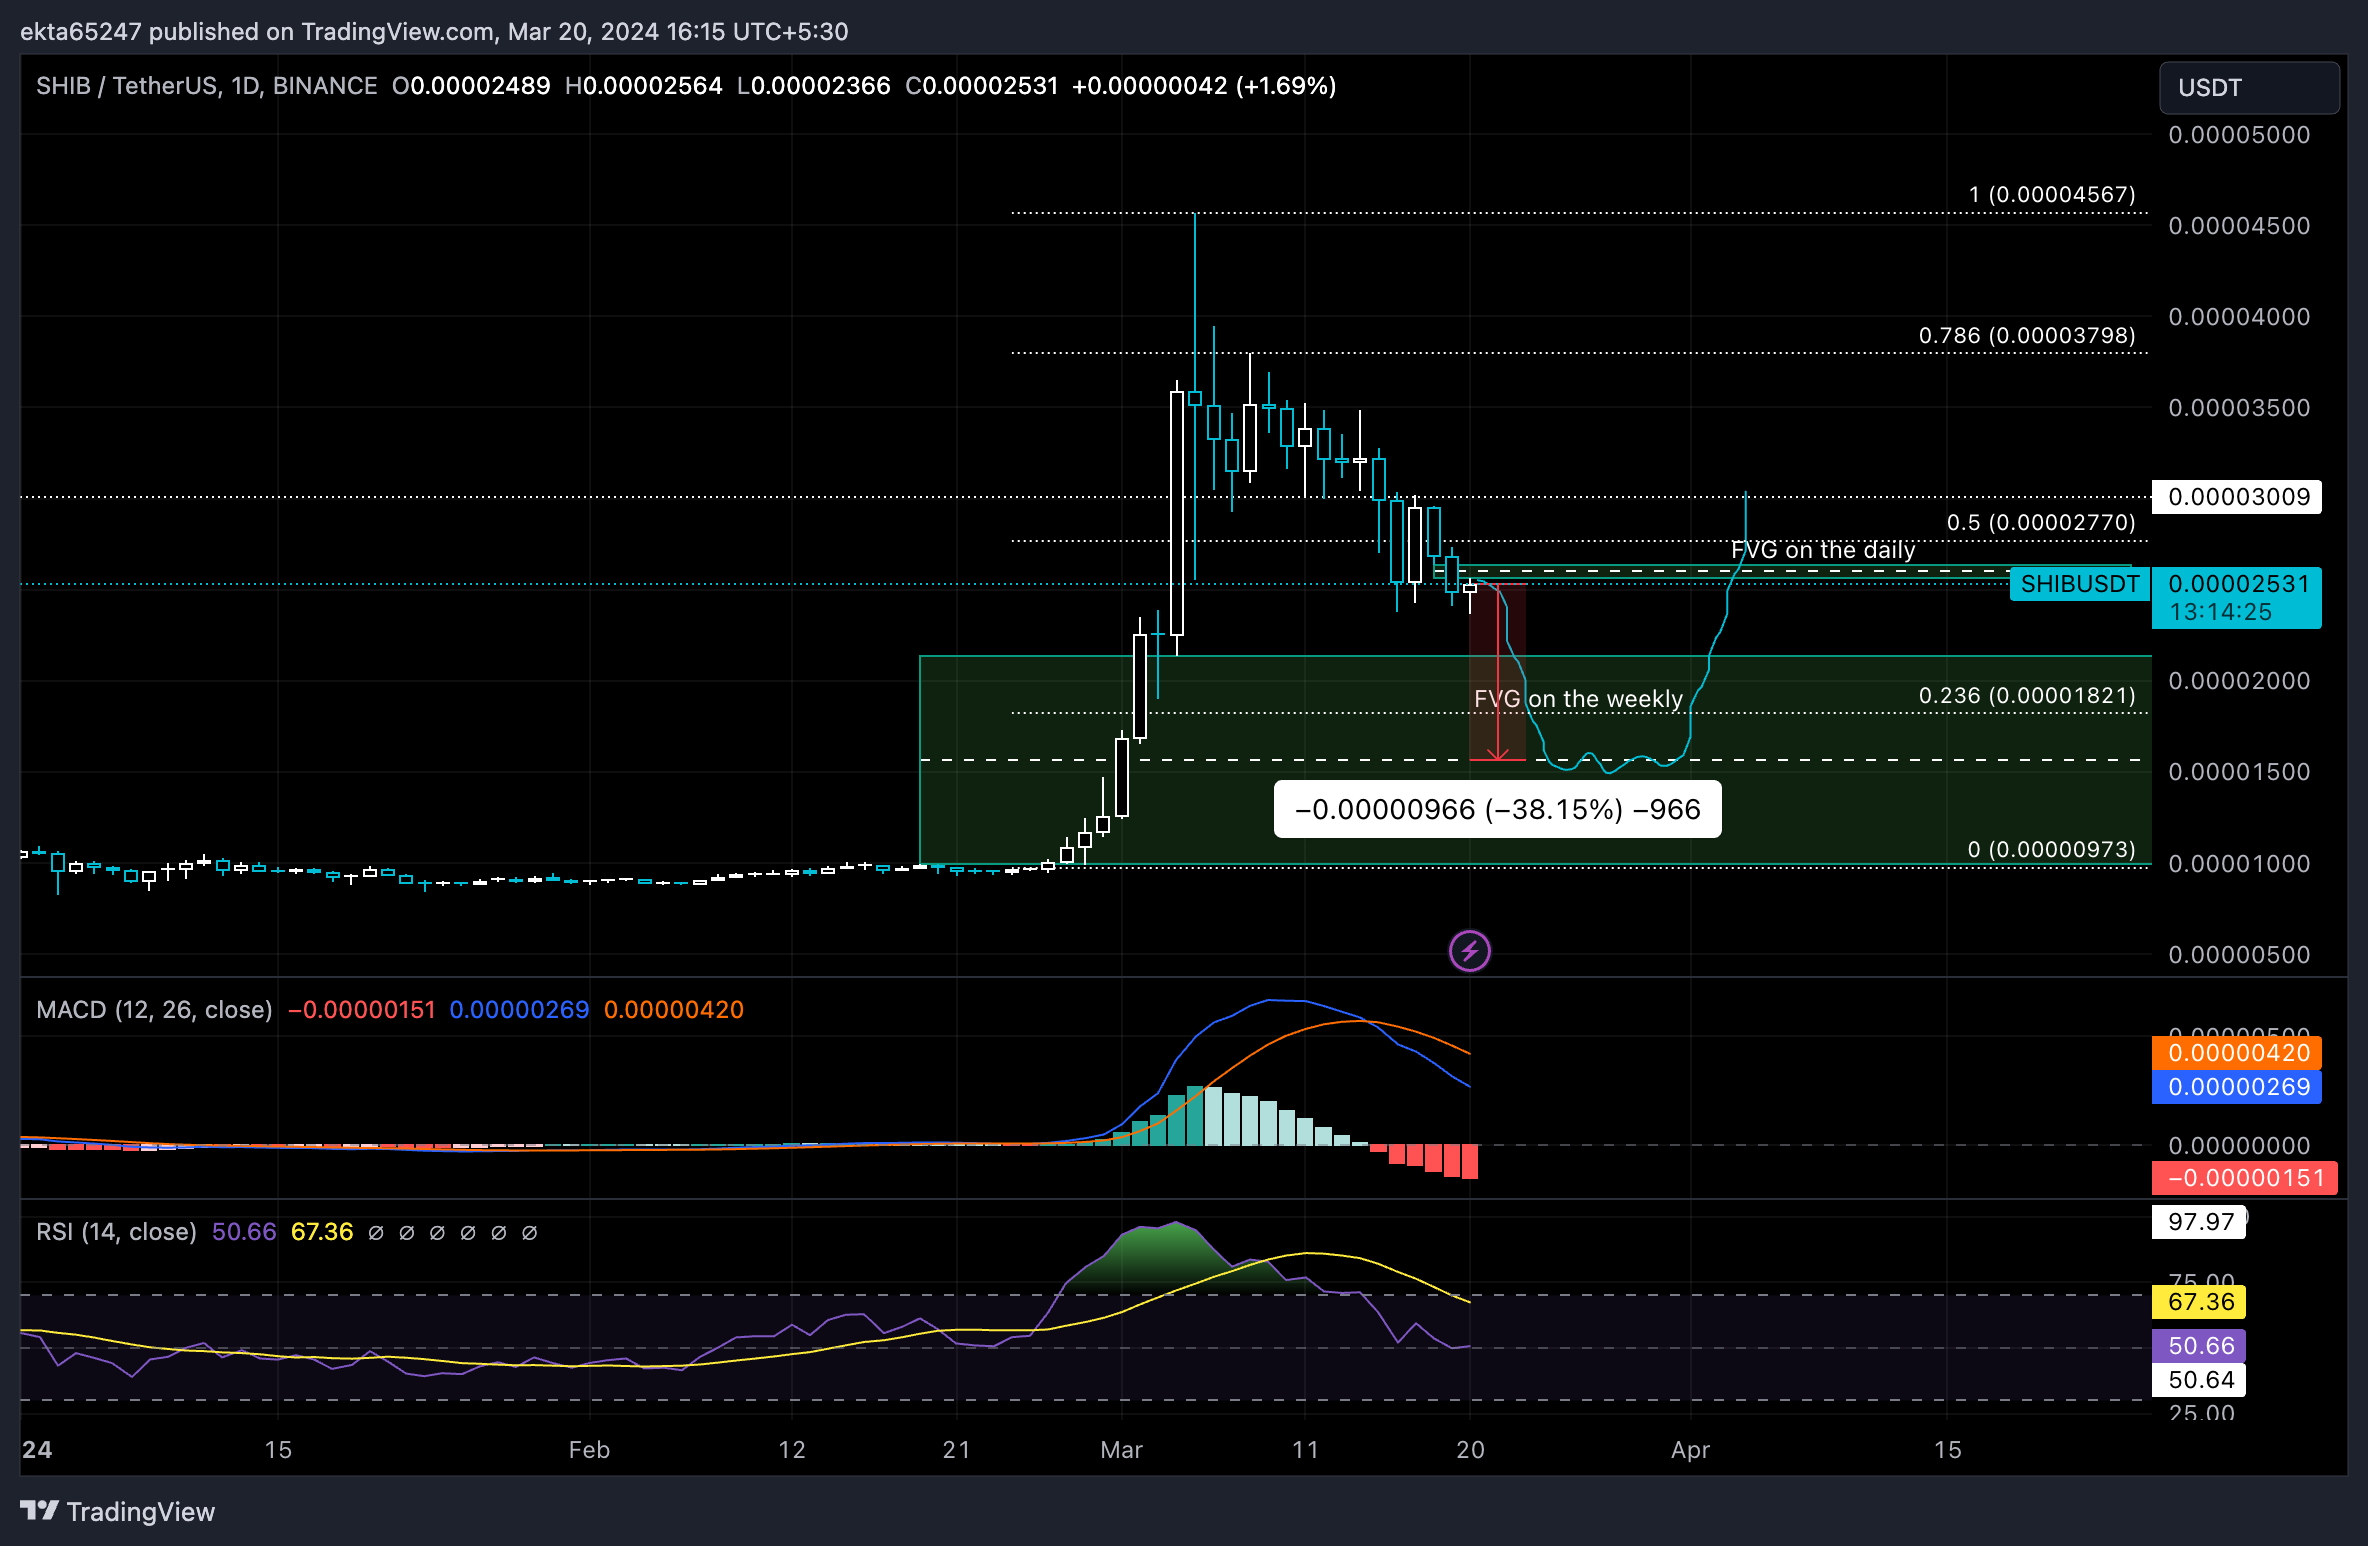
SHIB/USDT 1-day chart
In an upside scenario, a daily candlestick close above $0.0002630, the upper boundary of the FVG on the daily price chart, could invalidate the bearish thesis. The first resistances for SHIB price could would be $0.00003798, the 50% and 78.6% Fibonacci retracement levels.
Author

Ekta Mourya
FXStreet
Ekta Mourya has extensive experience in fundamental and on-chain analysis, particularly focused on impact of macroeconomics and central bank policies on cryptocurrencies.


