- Shiba Inu price attempts a bounce, but 21-DMA is a tough nut to crack.
- Shiba’s daily technical setup suggests that a range breakout is imminent.
- SHIB bulls remain hopeful while the price defends the key 100-DMA cap.
Shiba Inu is extending its week-long consolidative mode on Saturday, as the bears continue to lick their wounds following the December 4 flash crash to $0.0000295 levels.
In doing so, SHIB price is posting about 2.50% gains on a daily basis, attempting a bounce from one-week lows. At the time of writing, the canine-inspired coin is trading around $0.0000350, reversing the two back-to-back days of declines.
On Thursday, an Ethereum whale purchased close to $1.8 million worth of Shiba Inu, taking advantage of a 17% slide in the prices of the dog-themed cryptocurrency over the past week.
Shiba Inu remains stuck between two key averages, breakout awaited
Looking at Shiba Inu’s daily chart, it appears that SHIB bulls are attempting another attempt to kickstart a fresh upswing towards all-time highs of $0.0000885.
SHIB price is awaiting a strong catalyst to beak the current prison range around $0.0000350.
The price of the canine-themed coin has been traversing in a narrow range, with the upside guarded by the downward-sloping 21-Daily Moving Average (DMA), now at $0.0000400.
Meanwhile, the ascending 100-DMA at $0.0000315 continues to lend support to the bullish traders.
The 14-day Relative Strength Index (RSI), is inching higher towards the midline, suggesting that bulls could take over control if they recapture the 50.00 level.
SHIB bulls, however, need a daily closing above the 21-DMA hurdle to negate the bearish bias in the near term.
Fresh buying opportunities could then emerge, triggering an advance in Shiba Inu towards the mildly bullish 50-DMA at $0.0000488.
The next significant stop for SHIB bulls is envisioned at the November 30 highs of $0.0000543.
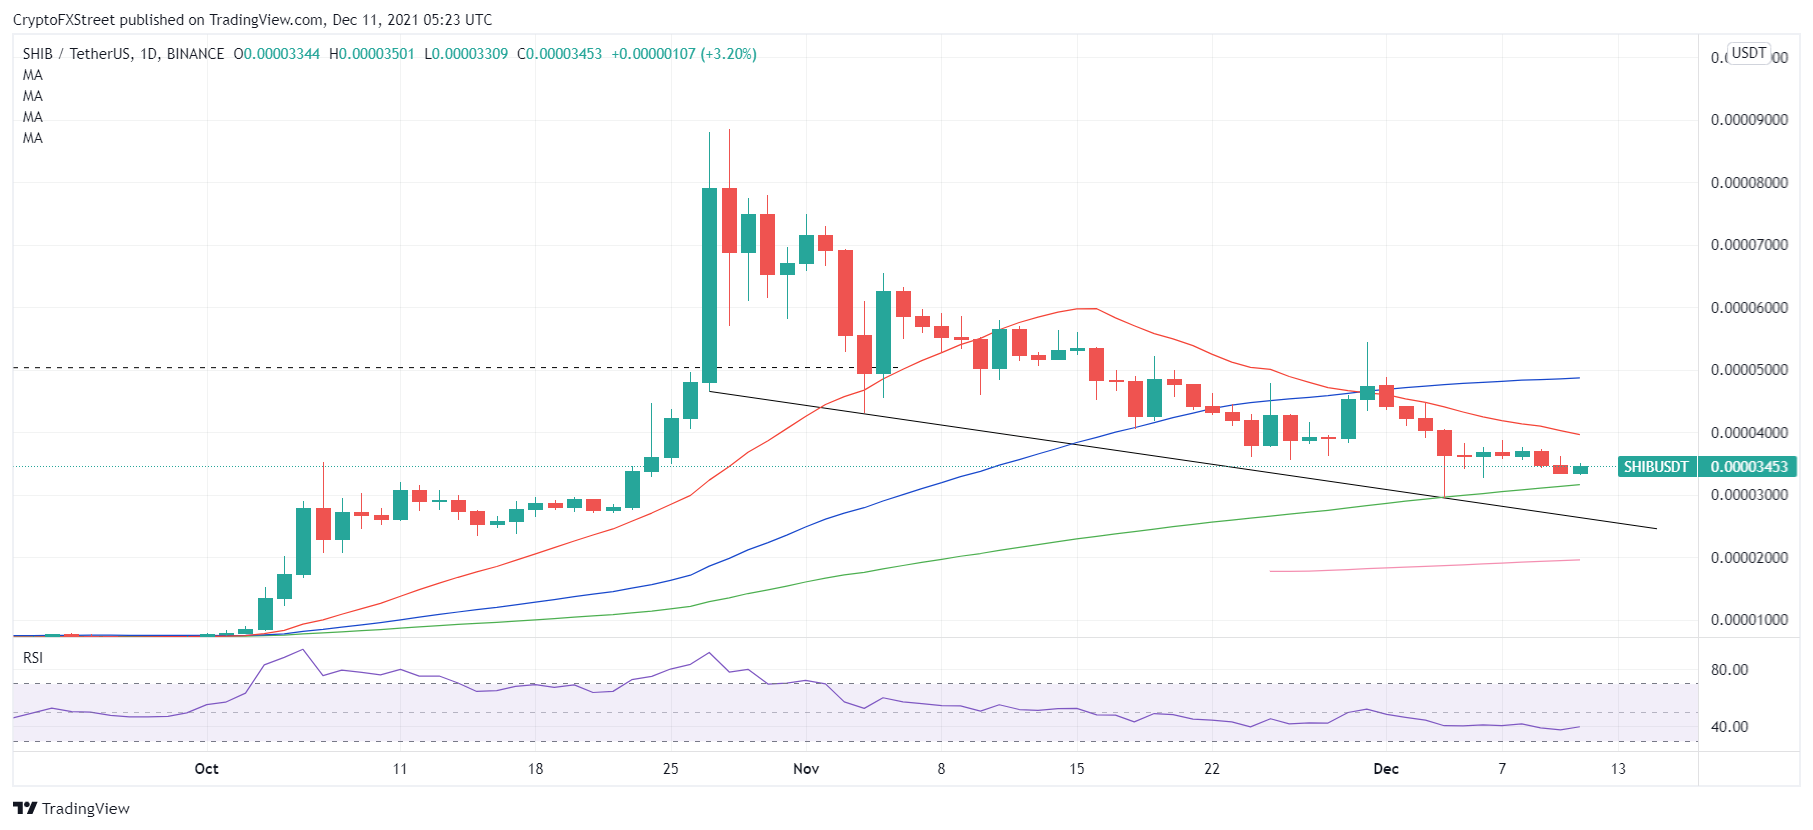
SHIB/USDT: Daily chart
On the other hand, if the bears regain control, then a sustained break below the 100-DMA support will be on the table.
On deeper declines, the falling trendline support, connecting the November 4 and December 4 lows, at $0.0000261 could come to the rescue of bulls.
SHIB sellers will then aim for the flattish 200-DMA at $0.0000196, as the next fierce upside barrier.
Information on these pages contains forward-looking statements that involve risks and uncertainties. Markets and instruments profiled on this page are for informational purposes only and should not in any way come across as a recommendation to buy or sell in these assets. You should do your own thorough research before making any investment decisions. FXStreet does not in any way guarantee that this information is free from mistakes, errors, or material misstatements. It also does not guarantee that this information is of a timely nature. Investing in Open Markets involves a great deal of risk, including the loss of all or a portion of your investment, as well as emotional distress. All risks, losses and costs associated with investing, including total loss of principal, are your responsibility. The views and opinions expressed in this article are those of the authors and do not necessarily reflect the official policy or position of FXStreet nor its advertisers. The author will not be held responsible for information that is found at the end of links posted on this page.
If not otherwise explicitly mentioned in the body of the article, at the time of writing, the author has no position in any stock mentioned in this article and no business relationship with any company mentioned. The author has not received compensation for writing this article, other than from FXStreet.
FXStreet and the author do not provide personalized recommendations. The author makes no representations as to the accuracy, completeness, or suitability of this information. FXStreet and the author will not be liable for any errors, omissions or any losses, injuries or damages arising from this information and its display or use. Errors and omissions excepted.
The author and FXStreet are not registered investment advisors and nothing in this article is intended to be investment advice.
Recommended Content
Editors’ Picks
Kyber exploiter asks for complete control of all assets after nearly $50 million exploit

Kyber network exploiter drained the protocol’s liquidity pools of nearly $50 million on November 22. The team behind Kyber managed to recover $4.67 million and communicated with the exploiter for the remainder of assets.
Chainlink supply on exchanges hits lowest point since 2020, with LINK staking v0.2 launch

Chainlink supply on exchanges declined to a level previously seen in February 2020. LINK staking v0.2 went live on November 28, attracting 68% of staked tokens from v0.1.
Bitcoin Spot ETF applications see amendments, holders await January batch approval

Bitcoin Spot ETF race has late entrants and updates from BlackRock, according to James Seyffart. BTC Spot ETF approval anticipation has fueled a rally in both spot and futures markets.
Ethereum Price Prediction: ETH top-down analysis hints upside is capped at $2,500

Ethereum price trades in a clear consolidative trend on the weekly time frame between $1,933 and $2,141 barriers. The daily chart for ETH shows a sweep of Monday’s high is likely to be followed by a sweep of Monday’s low at $1,985.
Three key BTC accumulation levels before ETF approval in January 2024

Bitcoin, from a high time-frame perspective, has been in an up-only trend since the start of 2023. BTC has ignored many sell signals due to the likelihood of an Exchange-Traded Fund approval. With the holidays around the corner, falling liquidity could see BTC discounted from its current level, hovering around the $37,000 region.