SafeMoon Price Forecast: SAFEMOON reveals a cosmic opportunity
- SafeMoon price nearly tags the descending triangle measured move target with a dramatic intra-day drop on August 16.
- SAFEMOON fortunes improve if it can trade above the bullish hammer candlestick printed on August 16.
- The 20-day simple moving average (SMA) and the 50-day SMA represent critical barriers to a sustainable trend.

SafeMoon price laid a bull trap on August 7 with the 39.59% gain and a daily close above the 20-day SMA at $0.00000259, the May 19 low of $0.00000261 and the descending triangle’s upper trend line. It was the best daily performance since May 6, but it was temporary, as SAFEMOON reverted to the downside on August 8 and quickly reached the triangle’s measured move of 57%. However, the bullish hammer candlestick pattern on the daily chart may signal exhaustion in selling interest and configure as the platform for an assertive rebound.
SafeMoon price gets left behind, but hard times may be over
SafeMoon price fell 44% on August 16 at the intra-day low before staging a significant turnaround and closing down only -7.69%. The sharp reversal of fortune plotted a bullish hammer candlestick on the daily chart and rewarded SAFEMOON speculators with a new entry price based on the hammer’s high of $0.00000207.
Yesterday, SafeMoon price closed with an inside day on the bar charts. It is following up the consolidation with a tighter range today, hinting at renewed volatility in the days ahead.
If the compression resolves to the upside and SAFEMOON overcomes the hammer candlestick high at $0.00000207, the altcoin will face three layers of resistance, beginning with the 20-day SMA at $0.00000218. The next crucial level of resistance for SafeMoon price is the May 19 low of $0.00000261, which formed the support for the descending triangle pattern. It is followed by the 50-day SMA at $0.00000270. Once SAFEMOON can record a daily close above the 50-day SMA, speculators can consider longer duration positions.
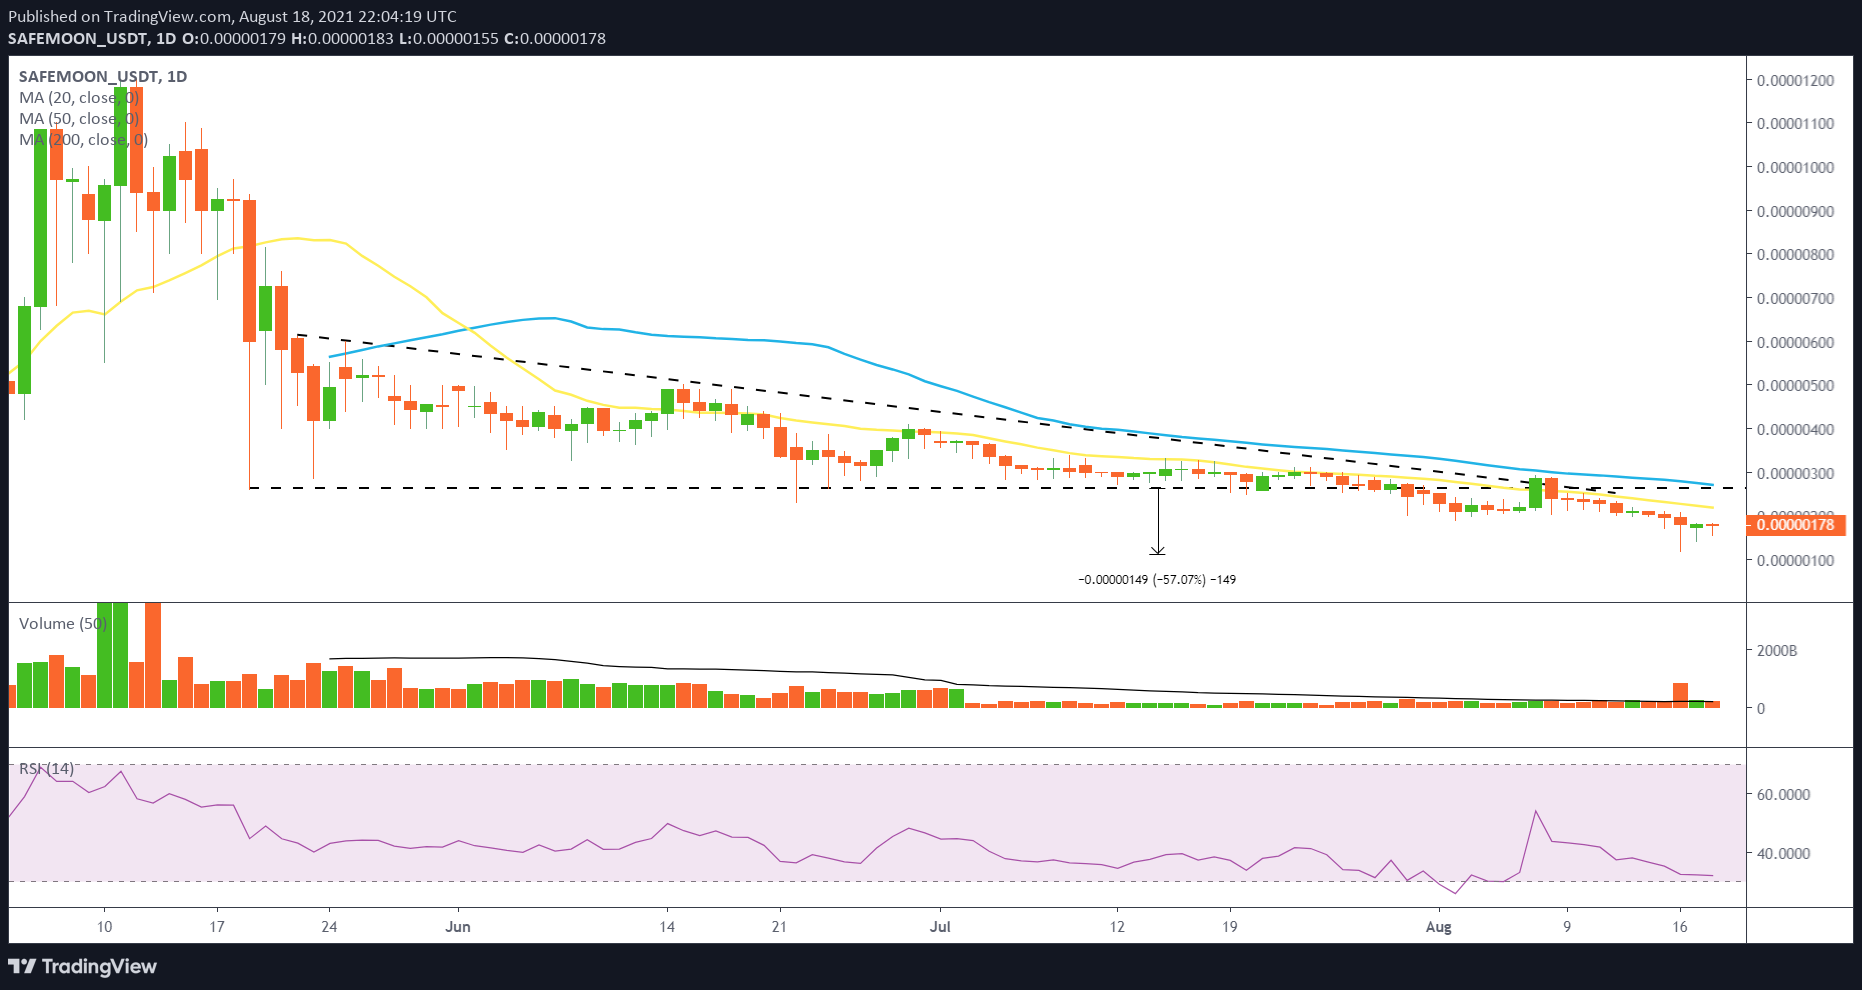
SAFEMOON/USDT daily chart
SafeMoon price is staging an upside breakout from a symmetrical triangle pattern on the four-hour chart for the short-term operators. The measured move of the triangle pattern is 41%, projecting a profit target of $0.00000246. A test of the profit target would position SAFEMOON at the 200 four-hour SMA at $0.00000245 but below the May 19 low and the 50-day SMA.
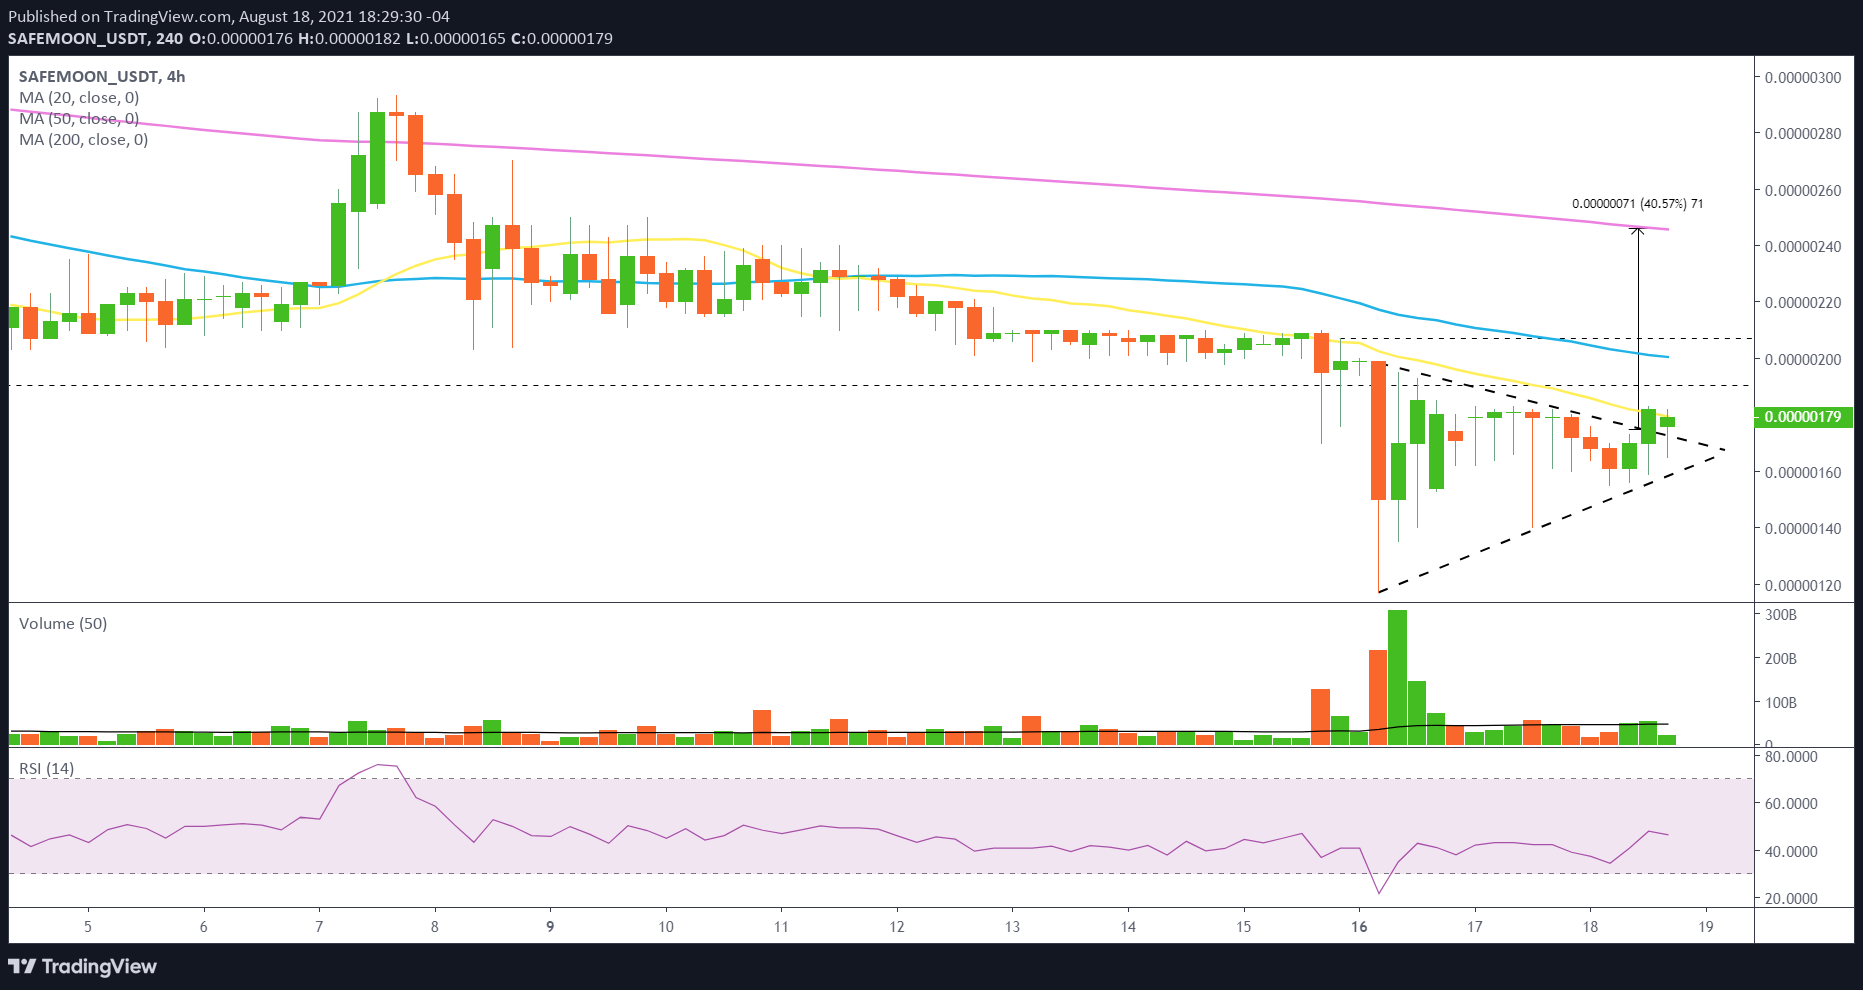
SAFEMOON/USDT 4-hour chart
The breakout from the symmetrical triangle is a bullish development for SafeMoon price, shifting the attention to better outcomes for the altcoin if the cryptocurrency can shake the chronic weakness. However, unless SAFEMOON can rally above the 50-day SMA at $0.00000270 on a daily closing basis, the emerging cosmic opportunity will be for the short-term speculators and not for the position-orientated investors with a long term horizon/interest in SAFEMOON.
Here, FXStreet's analysts evaluate where SAFEMOON could be heading next as it looks bearish from a technical perspective.
Author

Sheldon McIntyre, CMT
Independent Analyst
Sheldon has 24 years of investment experience holding various positions in companies based in the United States and Chile. His core competencies include BRIC and G-10 equity markets, swing and position trading and technical analysis.


