SafeMoon Price Forecast: SAFEMOON at an inflection point with a shortage of FOMO
- SafeMoon price is now being instructed by the declining 50 two-hour SMA.
- The second test of the May low on June 24 was quickly bought.
- SAFEMOON rallied a remarkable 70% from the June 22 low.

SafeMoon price has jumped from one downtrend to another, with the 50 two-hour simple moving average (SMA) always offering resistance and direction. SAFEMOON now resides below the moving average and a new trend line originating on June 18. Combined, the two technical obstacles pressure price and frame a daunting challenge for believers in the rookie cryptocurrency, thereby raising the probabilities that SafeMoon price visits the May low for a third time before mounting a sustainable breakout.
SafeMoon price can get up from the floor, but not putting up a good fight
In a spirited attempt to induce a campaign to “pop off” SafeMoon price on June 21, Reddit user “GMEandAMCbroughtme” on r/SatoshiStreetBets, encouraged SAFEMOON followers to create a crypto version of Gamestop and AMC. Unfortunately, the “biggest squeeze of all time” did not materialize as the altcoin fell below the May 19 low of $0.00000261 the following day, losing 20% on the two-hour candlestick.
SafeMoon price did not stay on the floor for very long before instigating a 70% rally beyond the 50 two-hour SMA at $0.00000368 that eventually topped at $0.00000385 on June 23, just above the June 18 trend line. Despite the limited market time, it was one of the better rebounds in the cryptocurrency market and represented some level of faith in SAFEMOON.
The good times ended quickly when SafeMoon price returned to the May low of $0.00000261 before staging another rebound that stalled at the 50 two-hour SMA. SAFEMOON has remained in a slow drift since the rebound, finding security between the May 25 trend line and the 50 two-hour moving average.
With the June 18 trend line putting pressure on SafeMoon price and the May 19 low remaining firm, SAFEMOON is nearing a vital resolution, likely by June 29 if the chart is correct.
If SafeMoon price closes above the June 18 trend line now at $0.00000333 on the two-hour chart, it should rally to the 200 two-hour SMA at $0.00000394, delivering a 20% return. A close above the 200 two-hour SMA will not detect resistance until the June 15 high of $0.00000500, offering a noteworthy return of 50% from the original SAFEMOON breakout.
An aggressive outlook for SafeMoon price should target the intersection of the May 25 high of $0.00000598 with the 38.2% Fibonacci retracement of the May correction at $0.00000601.
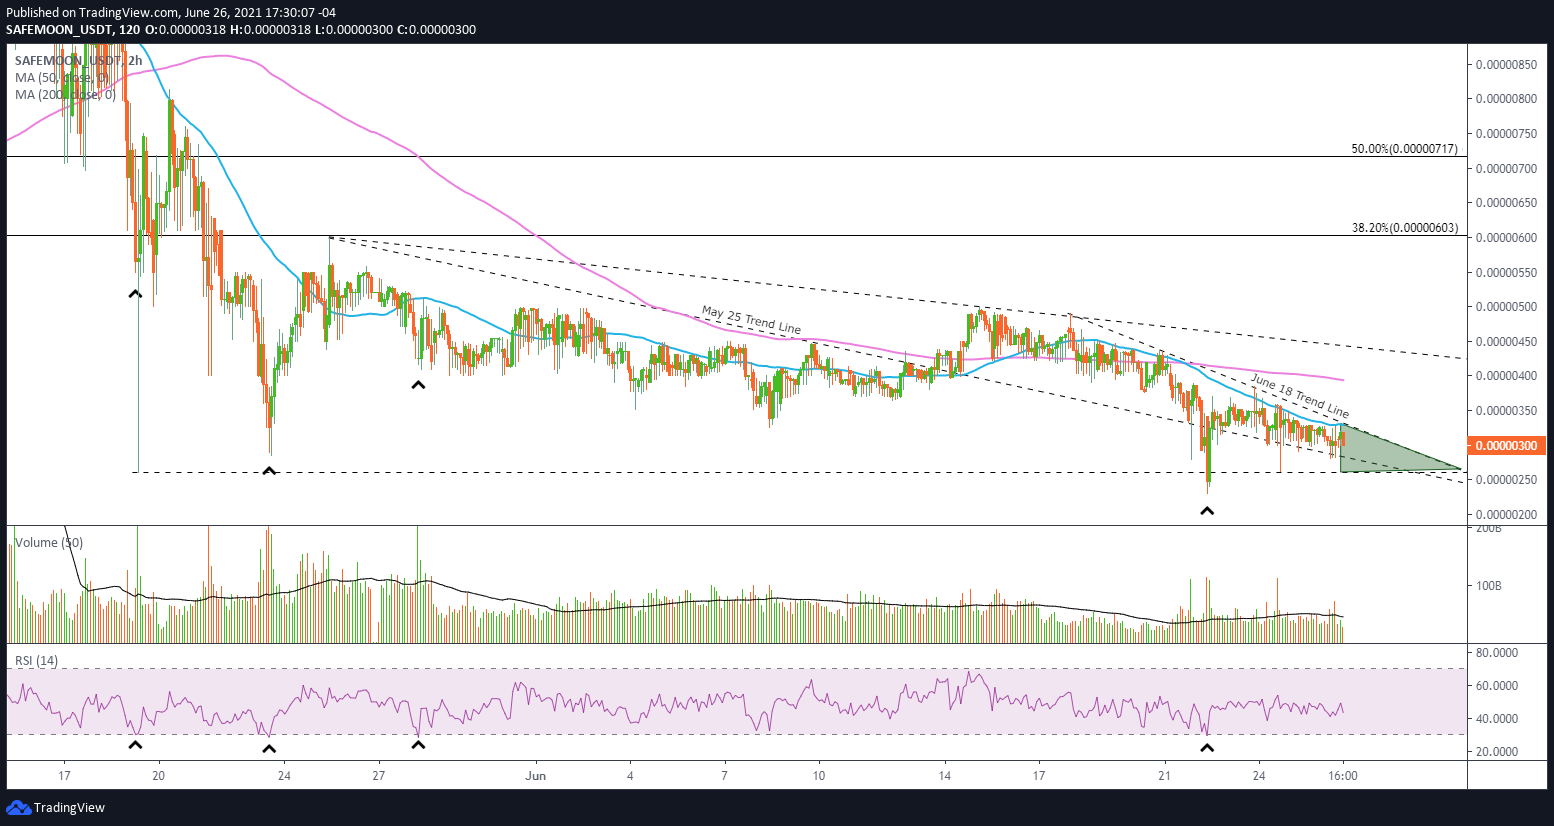
SAFEMOON/USD 2-hour chart
A decline below the May low of $0.00000261 could signal a dramatic decline, including a test of the April 21 crash low of $0.00000150. An unnecessary loss for investors, particularly when the levels are so precise and the SafeMoon price structure is transparent.
As long as the cryptocurrency market remains fluid and FOMO non-existent, SAFEMOON investors have no reason to test the market unless the critical resistance levels are broken on a closing basis.
At this moment, SafeMoon price appears to be in a lengthy bottoming process following the May correction, marked by stubborn moving average resistance, unremarkable levels of accumulation, and a general tendency to follow the cryptocurrency market trend. Therefore, until SAFEMOON can originate relative strength by exceeding outstanding resistance levels on a closing basis, market operators have no reason to risk capital.
Author

Sheldon McIntyre, CMT
Independent Analyst
Sheldon has 24 years of investment experience holding various positions in companies based in the United States and Chile. His core competencies include BRIC and G-10 equity markets, swing and position trading and technical analysis.


