Ripple Technical Analysis: XRP heads back towards $0.50 as charts lean bearish
- XRP/USD sellers return on Saturday as technicals lean bearish.
- The No. 3 coin wavers in a potential rising wedge on the hourly chart.
- Bearish 21-SMA on 4H chart offers stiff resistance on the road to recovery.

Ripple’s (XRP/USD) comeback from three-day lows appears to have lost traction on Saturday, as technical charts turn in favor of the bears in the near-term.
XRP/USD: Short-term technical outlook
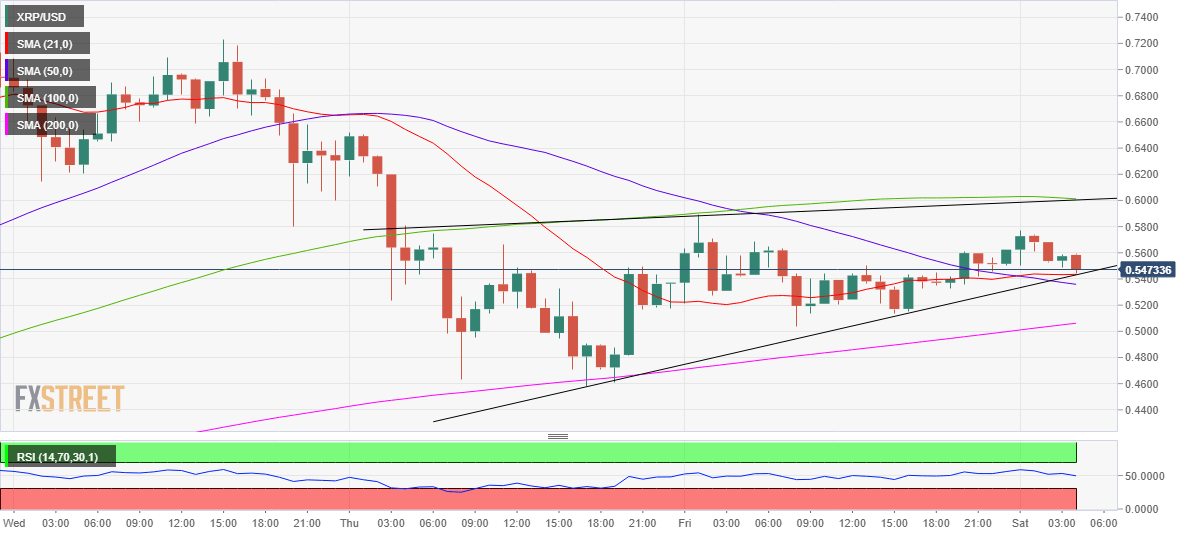
XRP/USD: Hourly chart
Ripple wavers in a rising wedge formation on the hourly chart, eyeing a bearish breakdown. A rising wedge is a bearish continuation pattern, with an hourly close below the rising trendline support of 0.5431 needed to validate the formation.
The Relative Strength Index (RSI) has turned south and breaches the midline, suggesting that the bears back in control. Further, the bearish crossover adds credence to the bearish shift in the sentiment around the price. In early dealings, the 50-hourly moving average (HMA) pierced the 21-HMA from above, triggering the pullback.
To the downside, 50-HMA support at 0.5360 could offer some temporary reprieve to the bulls. Meanwhile, the 200-HMA cushion at 0.5062 is the level to beat for the bears.
Alternatively, a powerful upside barrier awaits at 0.6005, the confluence of the 100-HMA and rising trendline resistance. A sustained break above the latter is critical to reviving the recovery momentum.
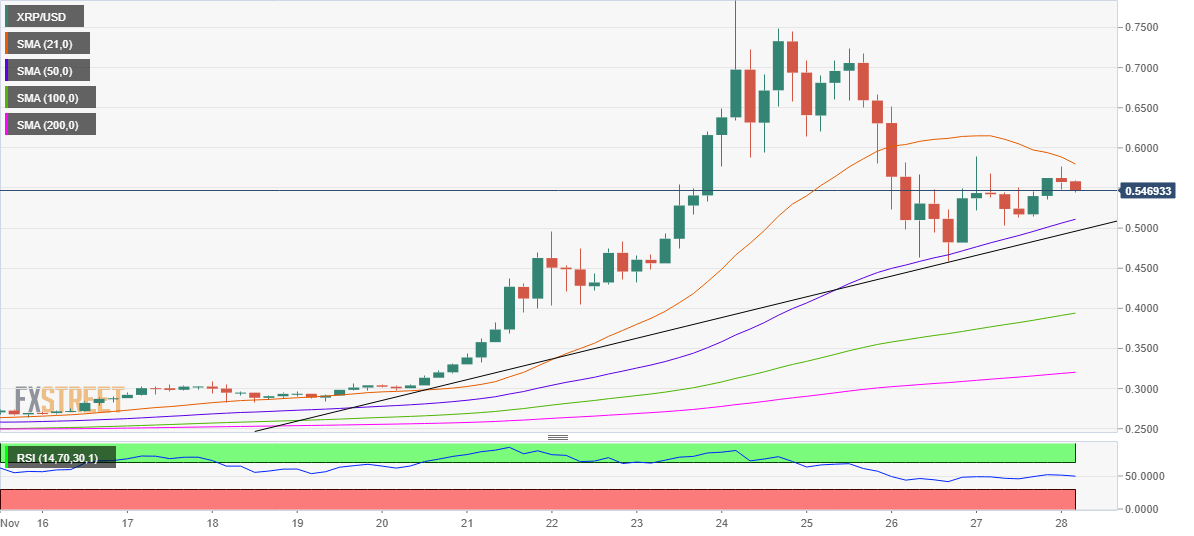
XRP/USD: Four-hour chart
Looking at the four-hour chart, the bearish 21-simple moving average (SMA), now at 0.5798, is capping the recovery in XRP/USD. Note that the spot hasn’t closed above the 21-SMA since early Thursday.
Therefore, the bulls need a convincing break above that key barrier, in order to extend Friday’s comeback. The next relevant target is seen at 0.6000. On the flip side, the upward-sloping 50-SMA at 0.5110 could offer support. Further south, the ten-day-old ascending trendline support at 0.4961 could be put at risk.
The RSI has flipped into bearish territory, currently trading at 49.68, backing the case for the downside.
XRP/USD: Additional levels to consider
Author

Dhwani Mehta
FXStreet
Residing in Mumbai (India), Dhwani is a Senior Analyst and Manager of the Asian session at FXStreet. She has over 10 years of experience in analyzing and covering the global financial markets, with specialization in Forex and commodities markets.


