• Ripple consolidates Friday’s relief rally from weekly lows.
  • A stack of support levels caps the downside with neutral RSI.
  • 0.1950 is the level to beat for the XRP bulls amid quiet trading.

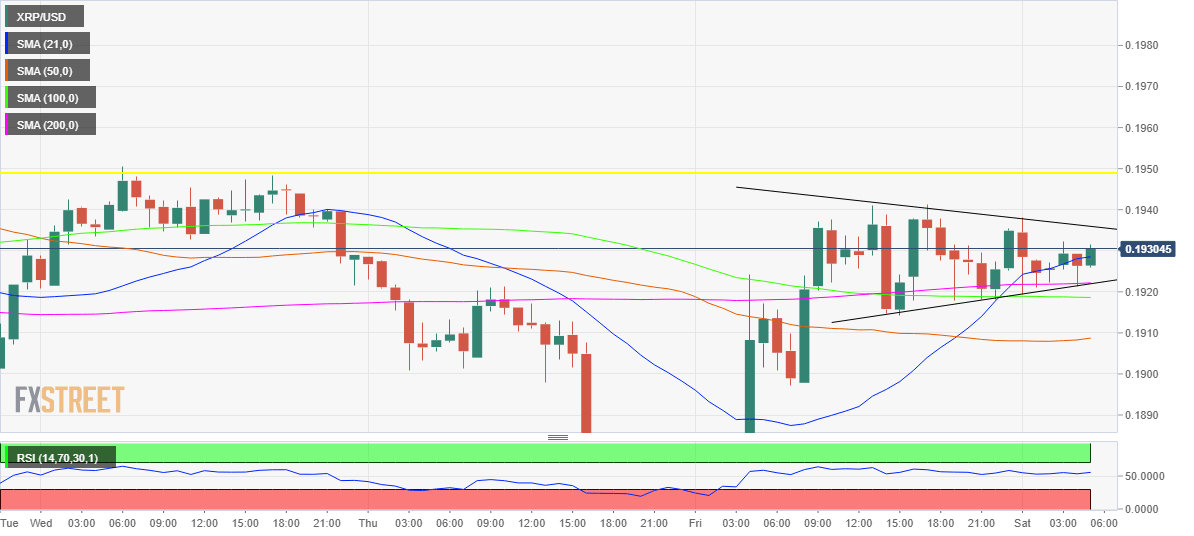
Having recovered sharply from weekly lows of 0.1846 on Friday, Ripple (XRP/USD) consolidates the relief rally in Saturday’s quiet trading so far, tracking the broad sentiment across the crypto space. The third-most traded cryptocurrency stalled its recovery momentum, as the bulls continued to run into stiff resistance near 0.1950 region. Despite the subdued trading activity, the coin enjoys a market capitalization of about $ 8.35 billion, up nearly 2% over the last 24 hours.

Near-term technical perspective

The prices are trapped in a symmetrical triangle spotted on the hourly sticks, with a sustained break above the descending trendline resistance at 0.1936 likely to confirm the said formation. The bullish breakout will suggest a continuation of the recent recovery in XRP/USD. Therefore, the coin could retest Friday’s high at 0.1941, above which the next resistance is aligned near 0.1950, the confluence of the horizontal trendline and psychological levels.

Should the bulls fail to take-out the 0.1936 barrier, the prices could drop back towards the key 0.1922 demand zone, where the ascending trendline and 200-hourly Simple Moving Average (HMA). A breach of the last would then validate a symmetrical triangle breakdown, opening floors for a test of the 0.1895 pattern target. On its south run, the bears could meet the immediate barrier at the horizontal 100-HMA at 0.1918. A failure to resist the last, the 50-HMA at 1.1908 would come into play.

All in all, the path of least resistance appears to the upside amid major supports aligned on a break lower while the hourly Relative Strength Index (RSI) stays neutral just above the mid-line.

XRP/USD 1-hour chart


XRP/USD key levels to consider


XRP/USD

Overview
Today last price 0.1929
Today Daily Change -0.0006
Today Daily Change % -0.31
Today daily open 0.1935
 
Trends
Daily SMA20 0.1937
Daily SMA50 0.2162
Daily SMA100 0.2466
Daily SMA200 0.2844
 
Levels
Previous Daily High 0.1941
Previous Daily Low 0.1846
Previous Weekly High 0.1985
Previous Weekly Low 0.1846
Previous Monthly High 0.233
Previous Monthly Low 0.1752
Daily Fibonacci 38.2% 0.1905
Daily Fibonacci 61.8% 0.1882
Daily Pivot Point S1 0.1874
Daily Pivot Point S2 0.1812
Daily Pivot Point S3 0.1779
Daily Pivot Point R1 0.1969
Daily Pivot Point R2 0.2002
Daily Pivot Point R3 0.2064


Information on these pages contains forward-looking statements that involve risks and uncertainties. Markets and instruments profiled on this page are for informational purposes only and should not in any way come across as a recommendation to buy or sell in these assets. You should do your own thorough research before making any investment decisions. FXStreet does not in any way guarantee that this information is free from mistakes, errors, or material misstatements. It also does not guarantee that this information is of a timely nature. Investing in Open Markets involves a great deal of risk, including the loss of all or a portion of your investment, as well as emotional distress. All risks, losses and costs associated with investing, including total loss of principal, are your responsibility. The views and opinions expressed in this article are those of the authors and do not necessarily reflect the official policy or position of FXStreet nor its advertisers. The author will not be held responsible for information that is found at the end of links posted on this page.

If not otherwise explicitly mentioned in the body of the article, at the time of writing, the author has no position in any stock mentioned in this article and no business relationship with any company mentioned. The author has not received compensation for writing this article, other than from FXStreet.

FXStreet and the author do not provide personalized recommendations. The author makes no representations as to the accuracy, completeness, or suitability of this information. FXStreet and the author will not be liable for any errors, omissions or any losses, injuries or damages arising from this information and its display or use. Errors and omissions excepted.

The author and FXStreet are not registered investment advisors and nothing in this article is intended to be investment advice.

Join Telegram

Recommended content


Recommended Content

Editors’ Picks

MANTA suffers 4% pullback after unlocking tokens worth $40 million

MANTA suffers 4% pullback after unlocking tokens worth $40 million

Manta Network (MANTA) unlocked over 8% of its circulating supply on Thursday. The unlocked tokens were airdropped and distributed in public sale, according to data from Tokenunlocks. 

More Cryptocurrencies News

XRP struggles to recover as lingering Ripple lawsuit could reach Supreme Court, former SEC litigator says

XRP struggles to recover as lingering Ripple lawsuit could reach Supreme Court, former SEC litigator says

The SEC vs. Ripple potential showdown at the Supreme Court is likely, says former SEC litigator Ladan Stewart. XRP Ledger calls developers, businesses and investors to build on the blockchain, extending Apex 2024 registration until April 30. 

More Ripple News

Bitcoin Layer 2 Merlin chain TVL climbs 20%, defying broad market correction

Bitcoin Layer 2 Merlin chain TVL climbs 20%, defying broad market correction

Merlin chain’s TVL added 20% this week, and crossed $800 million on Thursday. Bitcoin Layer 2 assets noted double-digit losses in the past week. Stacks, Elastos, SatoshiVM, BVM are hit by a correction as Bitcoin hovers around $61,000. 

More Bitcoin News

If Bitcoin restarts bull run, these altcoins are likely to explode Premium

If Bitcoin restarts bull run, these altcoins are likely to explode

If Bitcoin’s consolidation ends and the bull run resumes, altcoins are likely going to trigger a massive rally. Last cycle’s hot tokens like SOL, AVAX, WIF, ONDO, etc., could see renewed enthusiasm. 

More Cryptocurrencies News

Bitcoin: BTC’s rangebound movement leaves traders confused

Bitcoin: BTC’s rangebound movement leaves traders confused

Bitcoin (BTC) price has been hovering around the $70,000 psychological level for a few weeks, resulting in a rangebound movement. This development could lead to a massive liquidation on either side before a directional move is established. 

Read full analysis

BTC

ETH

XRP