• Ripple picking up bids amid quiet Easter trading.
  • Technical set up points to a bullish bias in the near-term.
  • Hourly RSI has climbed back above the midline.

The rebound in Ripple (XRP/USD) from daily troughs of 0.1864 has gained momentum over the last hours, as the bulls look to regain the 0.1900 level. The price finally broke the recent consolidative mode to the upside, resuming the recovery momentum from Friday’s low of 0.1817. The third-most favorite cryptocurrency trades at 0.1890, having reversed the early losses while up nearly 5% over the week. Its market capitalization stands at $8.31 billion.

Short-term technical outlook

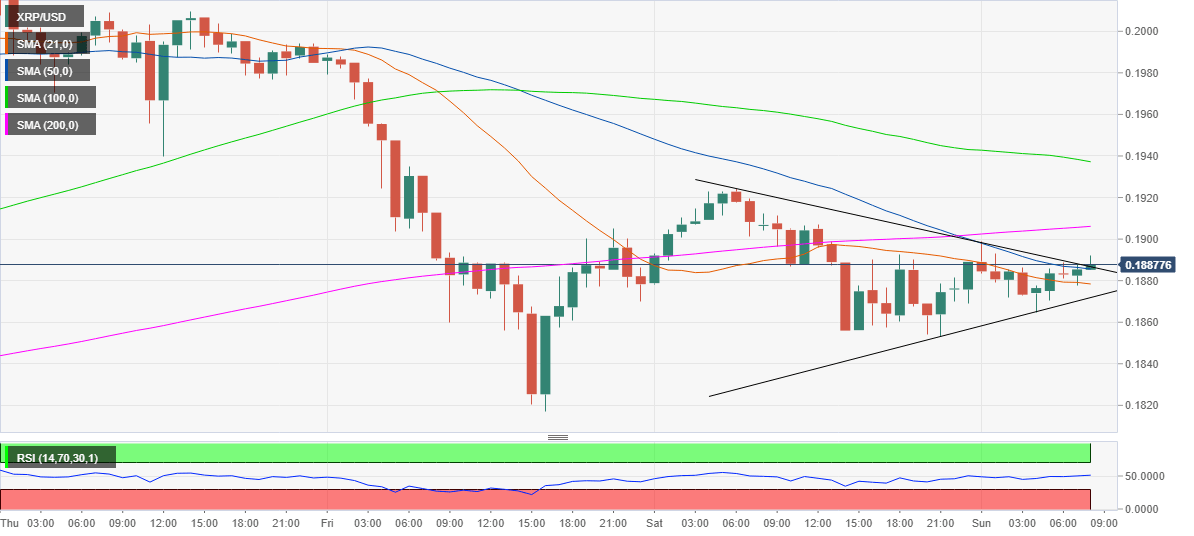
Looking at the hourly sticks, the price has charted a symmetrical triangle breakout after it broke through the pattern falling trendline resistance at 0.1888. The move higher picked up pace once the coin regained the 21 and 50-hourly Simple Moving Averages (HMA) at 0.1878 and 0.1885 respectively.

On its way north to reach the pattern target at 0.1958, XRP/USD could likely face the initial hurdle at 0.1906, the horizontal 200-HMA, beyond which the next resistance at the 100-HMA of 0.1937 will be tested. The hourly Relative Strength Index (RSI) has steadily crawled back above the midline, 50.0, suggesting that the bulls could take back charge.

To the downside, any pullback is likely to find the initial cushioning at the 21-HMA resistance-turned-support. A failure to resist the latter, the coin will reverse further to test the 0.1865 area, the confluence of the pattern rising trendline support and daily low.

XRP/USD 1-hour chart


XRP/USD key levels to consider

XRP/USD

Overview
Today last price 0.1890
Today Daily Change 0.0001
Today Daily Change % 0.05
Today daily open 0.1889
 
Trends
Daily SMA20 0.1791
Daily SMA50 0.1951
Daily SMA100 0.2218
Daily SMA200 0.2346
 
Levels
Previous Daily High 0.1925
Previous Daily Low 0.1853
Previous Weekly High 0.2053
Previous Weekly Low 0.1767
Previous Monthly High 0.2468
Previous Monthly Low 0.1129
Daily Fibonacci 38.2% 0.1897
Daily Fibonacci 61.8% 0.188
Daily Pivot Point S1 0.1853
Daily Pivot Point S2 0.1817
Daily Pivot Point S3 0.1781
Daily Pivot Point R1 0.1925
Daily Pivot Point R2 0.196
Daily Pivot Point R3 0.1996


Information on these pages contains forward-looking statements that involve risks and uncertainties. Markets and instruments profiled on this page are for informational purposes only and should not in any way come across as a recommendation to buy or sell in these assets. You should do your own thorough research before making any investment decisions. FXStreet does not in any way guarantee that this information is free from mistakes, errors, or material misstatements. It also does not guarantee that this information is of a timely nature. Investing in Open Markets involves a great deal of risk, including the loss of all or a portion of your investment, as well as emotional distress. All risks, losses and costs associated with investing, including total loss of principal, are your responsibility. The views and opinions expressed in this article are those of the authors and do not necessarily reflect the official policy or position of FXStreet nor its advertisers. The author will not be held responsible for information that is found at the end of links posted on this page.

If not otherwise explicitly mentioned in the body of the article, at the time of writing, the author has no position in any stock mentioned in this article and no business relationship with any company mentioned. The author has not received compensation for writing this article, other than from FXStreet.

FXStreet and the author do not provide personalized recommendations. The author makes no representations as to the accuracy, completeness, or suitability of this information. FXStreet and the author will not be liable for any errors, omissions or any losses, injuries or damages arising from this information and its display or use. Errors and omissions excepted.

The author and FXStreet are not registered investment advisors and nothing in this article is intended to be investment advice.

Join Telegram

Recommended content


Recommended Content

Editors’ Picks

Ethereum dips below key level as Hong Kong ETFs underperform

Ethereum dips below key level as Hong Kong ETFs underperform

Ethereum (ETH) experienced a further decline on Tuesday following a disappointing first-day trading volume for Hong Kong's spot Bitcoin and ETH ETFs. This comes off the back of increased long liquidations and mixed whale activity surrounding the top altcoin.

More Ethereum News

Bitcoin Cash advocate Roger Ver arrested and charged with falsifying taxes

Bitcoin Cash advocate Roger Ver arrested and charged with falsifying taxes

Bitcoin Cash (BCH) proponent Roger Ver, also an early Bitcoin investor, was allegedly picked up by Spanish authorities over the weekend on charges of tax fraud by the US DOJ. 

More Bitcoin Cash News

Bitcoin price dips into $60K range as spot traders flock to Coinbase Lightning Network

Bitcoin price dips into $60K range as spot traders flock to Coinbase Lightning Network

Bitcoin slid lower on Tuesday during the opening hours of the New York session, dipping its toes into a crucial chart area. It comes as markets continue to digest the performance of Hong Kong ETFs.

More Bitcoin News

Renzo's REZ dips after airdrop and Binance listing

Renzo's REZ dips after airdrop and Binance listing

Renzo users could claim their airdrop based on accumulated ezPoints. REZ dips about 35% after listing on Binance and several other exchanges. Renzo seems to have gotten over an earlier scare from ezETH depeg last week.

More Renzo News

Bitcoin: BTC’s next breakout could propel it to $80,000 Premium

Bitcoin: BTC’s next breakout could propel it to $80,000

Bitcoin’s (BTC) recent price consolidation could be nearing its end as technical indicators and on-chain metrics suggest a potential upward breakout. However, this move would not be straightforward and could punish impatient investors. 

Read full analysis

BTC

ETH

XRP