- Ripple price retests an inclining trendline, connecting the swing lows from mid-2022.
- Investors should prepare for a potential deviation below this trend line that retests $0.468.
- A recovery above $0.532 could see XRP revisit the $0.696 resistance level.
- A decisive flip of $0.468 could see the remittance token revisit $0.379
Ripple (XRP) price has been on a slow uptrend stuck between two inclining trend lines. The recent revisit of the lower trend line does not look for XRP, but the outlook could improve if certain conditions are met.
Also read: Top 3 Price Prediction Bitcoin, Ethereum, Ripple: BTC gains strength as GBTC outflows shrink
Ripple price needs a plan
Ripple price has been on a steady uptrend with higher highs and higher lows since June 2022. Every time XRP revisits the lower trend line, it bounces higher, producing a new swing high. Considering the stale market conditions where only a select few coins are rallying, it is highly unlikely the remittance token kickstarts its rally.
Hence, investors should be wary of opening swing-long positions at the current level of $0.507. Instead, they should expect the following:
XRP price to fully breach the inclining trend line and retest or sweep the $0.468 support level.
While this development is bearish in the short term, traders should watch for a quick recovery above the $0.532 support level and the inclining trend line.
If the above two conditions are met, it will cement the bullish stance for the remittance token. In such a case, investors can expect XRP price to resume its uptrend and tag the immediate resistance level at $0.696.
Read more: Binance freezes $4.2M in XRP tokens stolen from Ripple executive's wallet
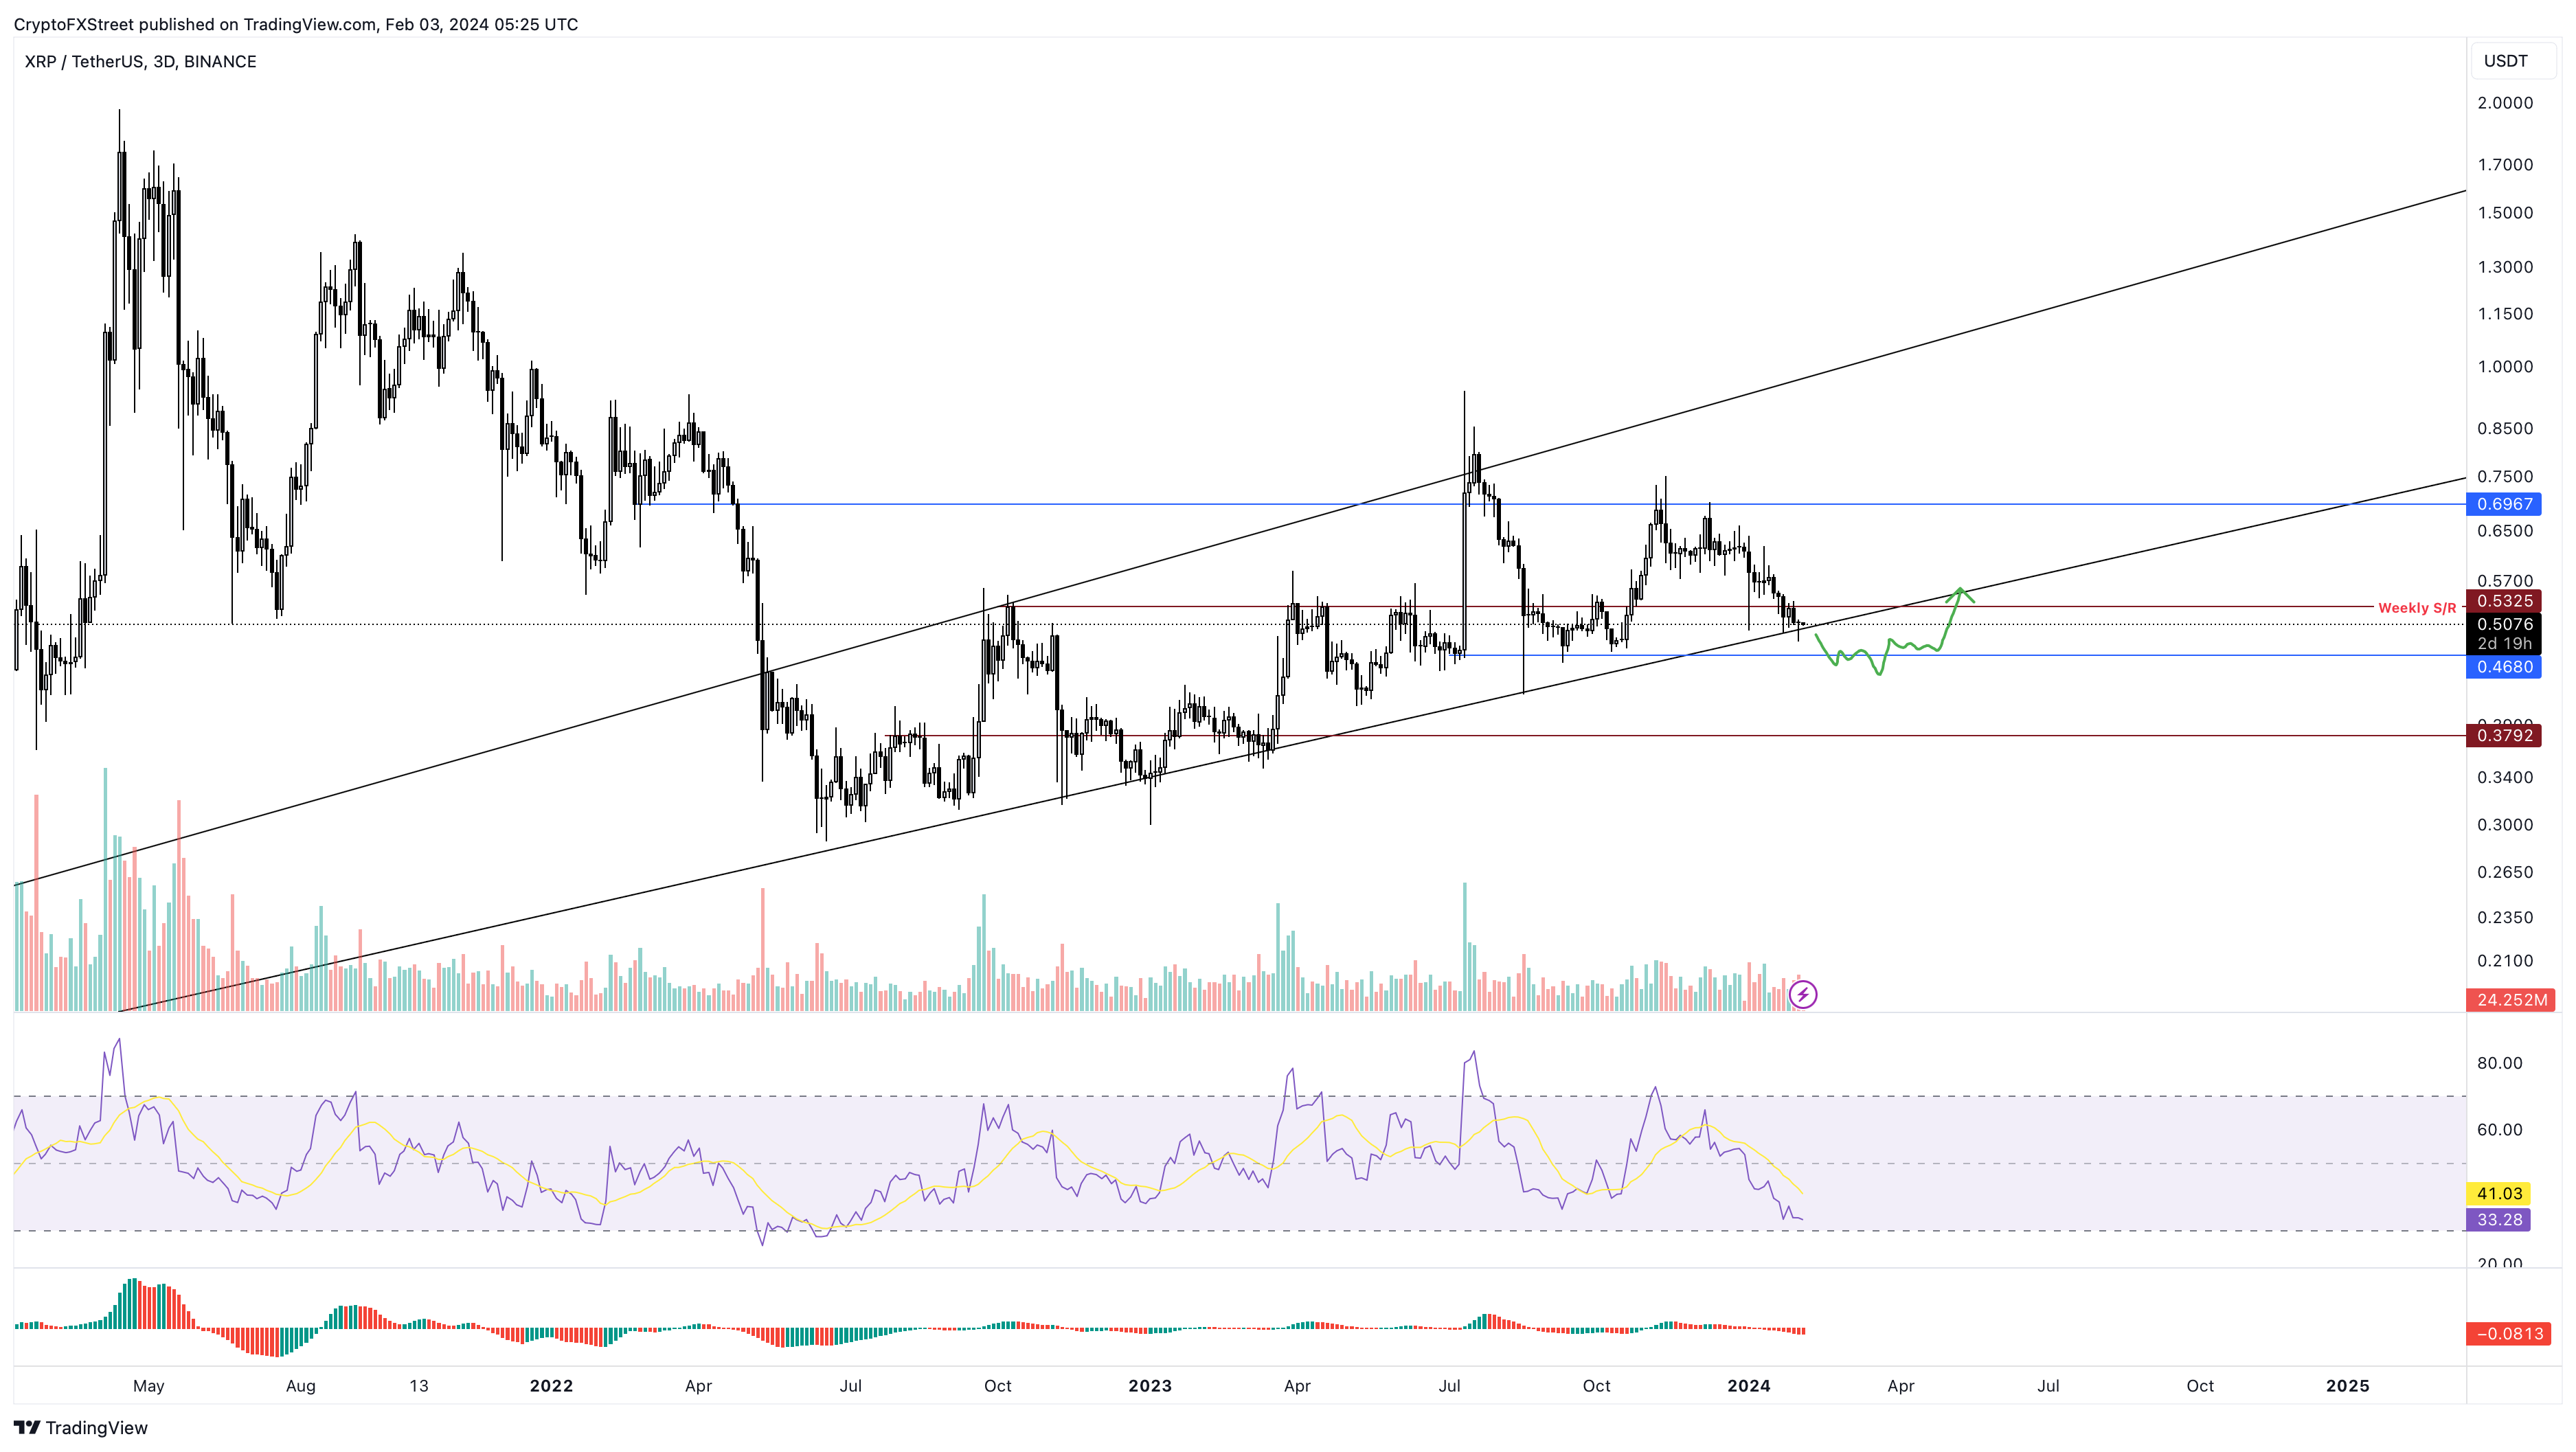
XRP/USDT 3-day chart
On the contrary, if XRP price retests the $0.468 support level but fails to bounce from here, it would signal a weakness in the bullish camp. If the remittance token flips the aforementioned level into a resistance level, it will invalidate the bullish thesis for Ripple.
In such a case, XRP price could crash roughly 18% and revisit the $0.379 support floor.
Information on these pages contains forward-looking statements that involve risks and uncertainties. Markets and instruments profiled on this page are for informational purposes only and should not in any way come across as a recommendation to buy or sell in these assets. You should do your own thorough research before making any investment decisions. FXStreet does not in any way guarantee that this information is free from mistakes, errors, or material misstatements. It also does not guarantee that this information is of a timely nature. Investing in Open Markets involves a great deal of risk, including the loss of all or a portion of your investment, as well as emotional distress. All risks, losses and costs associated with investing, including total loss of principal, are your responsibility. The views and opinions expressed in this article are those of the authors and do not necessarily reflect the official policy or position of FXStreet nor its advertisers. The author will not be held responsible for information that is found at the end of links posted on this page.
If not otherwise explicitly mentioned in the body of the article, at the time of writing, the author has no position in any stock mentioned in this article and no business relationship with any company mentioned. The author has not received compensation for writing this article, other than from FXStreet.
FXStreet and the author do not provide personalized recommendations. The author makes no representations as to the accuracy, completeness, or suitability of this information. FXStreet and the author will not be liable for any errors, omissions or any losses, injuries or damages arising from this information and its display or use. Errors and omissions excepted.
The author and FXStreet are not registered investment advisors and nothing in this article is intended to be investment advice.
Recommended Content
Editors’ Picks
Sui bulls eyes for a new all-time high of $6.35
Sui price recovers most of its weekly losses and trades around $5.06 at the time of writing on Friday. On-chain metrics hint at a rally ahead as SUI’s long-to-short ratio reaches the highest level in over a month, and open interest is also rising.
Bitcoin Weekly Forecast: Room for a recovery or continuation of the pullback?
Bitcoin’s price slightly recovers and trades around $94,700 on Friday after declining nearly 6% earlier this week. US Bitcoin spot Exchange Traded Funds data shows signs of mild recovery, with a total net inflow of $462.2 million until Thursday.
Top 3 Price Prediction Bitcoin, Ethereum, Ripple: All hints for a continuation of the correction
Bitcoin retests its key support level of $92,493; a firm close below it could continue its ongoing correction. Ethereum price closed below its crucial support level of $3,236, suggesting the continuation of the pullback.
XRP funding rates flashes negative, eyes $2.17 following 4% decline
Ripple's XRP declined 4% on Friday following a decline in its funding rates. The remittance-based token could decline to test the $2.17 support level if the crypto market decline extends.
Bitcoin: Room for a recovery or continuation of the pullback?
Bitcoin’s (BTC) price slightly recovers and trades around $94,700 on Friday after declining nearly 6% earlier this week. US Bitcoin spot Exchange Traded Funds (ETF) data shows signs of mild recovery, with a total net inflow of $462.2 million until Thursday. A 10xResearch report released this week projects Bitcoin’s price action for the upcoming major events in January.
Best Forex Brokers with Low Spreads
VERIFIED Low spreads are crucial for reducing trading costs. Explore top Forex brokers offering competitive spreads and high leverage. Compare options for EUR/USD, GBP/USD, USD/JPY, and Gold.