Ripple Price Forecast: Declining network growth and underwater XRP holders suggest more downside for XRP price
- XRP price trades at $0.511 after dropping 6% in the last month.
- The disinclination towards buying can be noticed in declining network growth spurts.
- Holders selling their tokens at a loss, suggesting that investors are not bullish on the long-term.
- A continuation of the downtrend could see Ripple drop 19% to $0.407.

Ripple (XRP) price shows a lack of buying pressure after its win against the US Securities and Exchange Commission (SEC) on July 13. Since then, the remittance token has been on a downtrend. Considering Ripple’s current position, a further decline would not be surprising.
Read more: Ripple CEO calls out SEC and Chair Gary Gensler, saying, “Everything the SEC cares about, they lost”
Ripple holders flee
XRP price has shed a whopping 47% since July 13, when Ripple scored a partial victory against the SEC. Currently, the remittance token trades at $0.507, with on-chain metrics suggesting an increasing bearish outlook.
The 30-day average of 24-hour active addresses currently sits at 15,500, which is down 89% from 144,700 as seen on August 13. This sharp decline indicates a diminishing interest from XRP investors, which in turn denotes a flight of capital.
 [13.52.54, 24 Sep, 2023]-638311405984674154.png)
XRP 24-hour active addresses
Furthermore, the Network Growth is also showing a steady decline with lower highs. This index further adds credence to the declining investors' interest, as seen above.
 [13.52.59, 24 Sep, 2023]-638311406086250395.png)
XRP network growth
The Realized Network Profit/Loss indicator puts the final bearish nail in the coffin, which shows negative spikes after August 1, suggesting that investors are selling their holdings and realizing losses.
 [13.53.03, 24 Sep, 2023]-638311406290763670.png)
XRP network realzied profit/loss
XRP price ready to slide lower
With multiple bearish on-chain metrics, investors can only expect Ripple (XRP) price to slide lower. Currently, the remittance token trades at $0.507 after flipping the $0.541 resistance level into a support floor.
A failure from the buyers’ end to step up could trigger a 19% decline to the next key support level at $0.407.
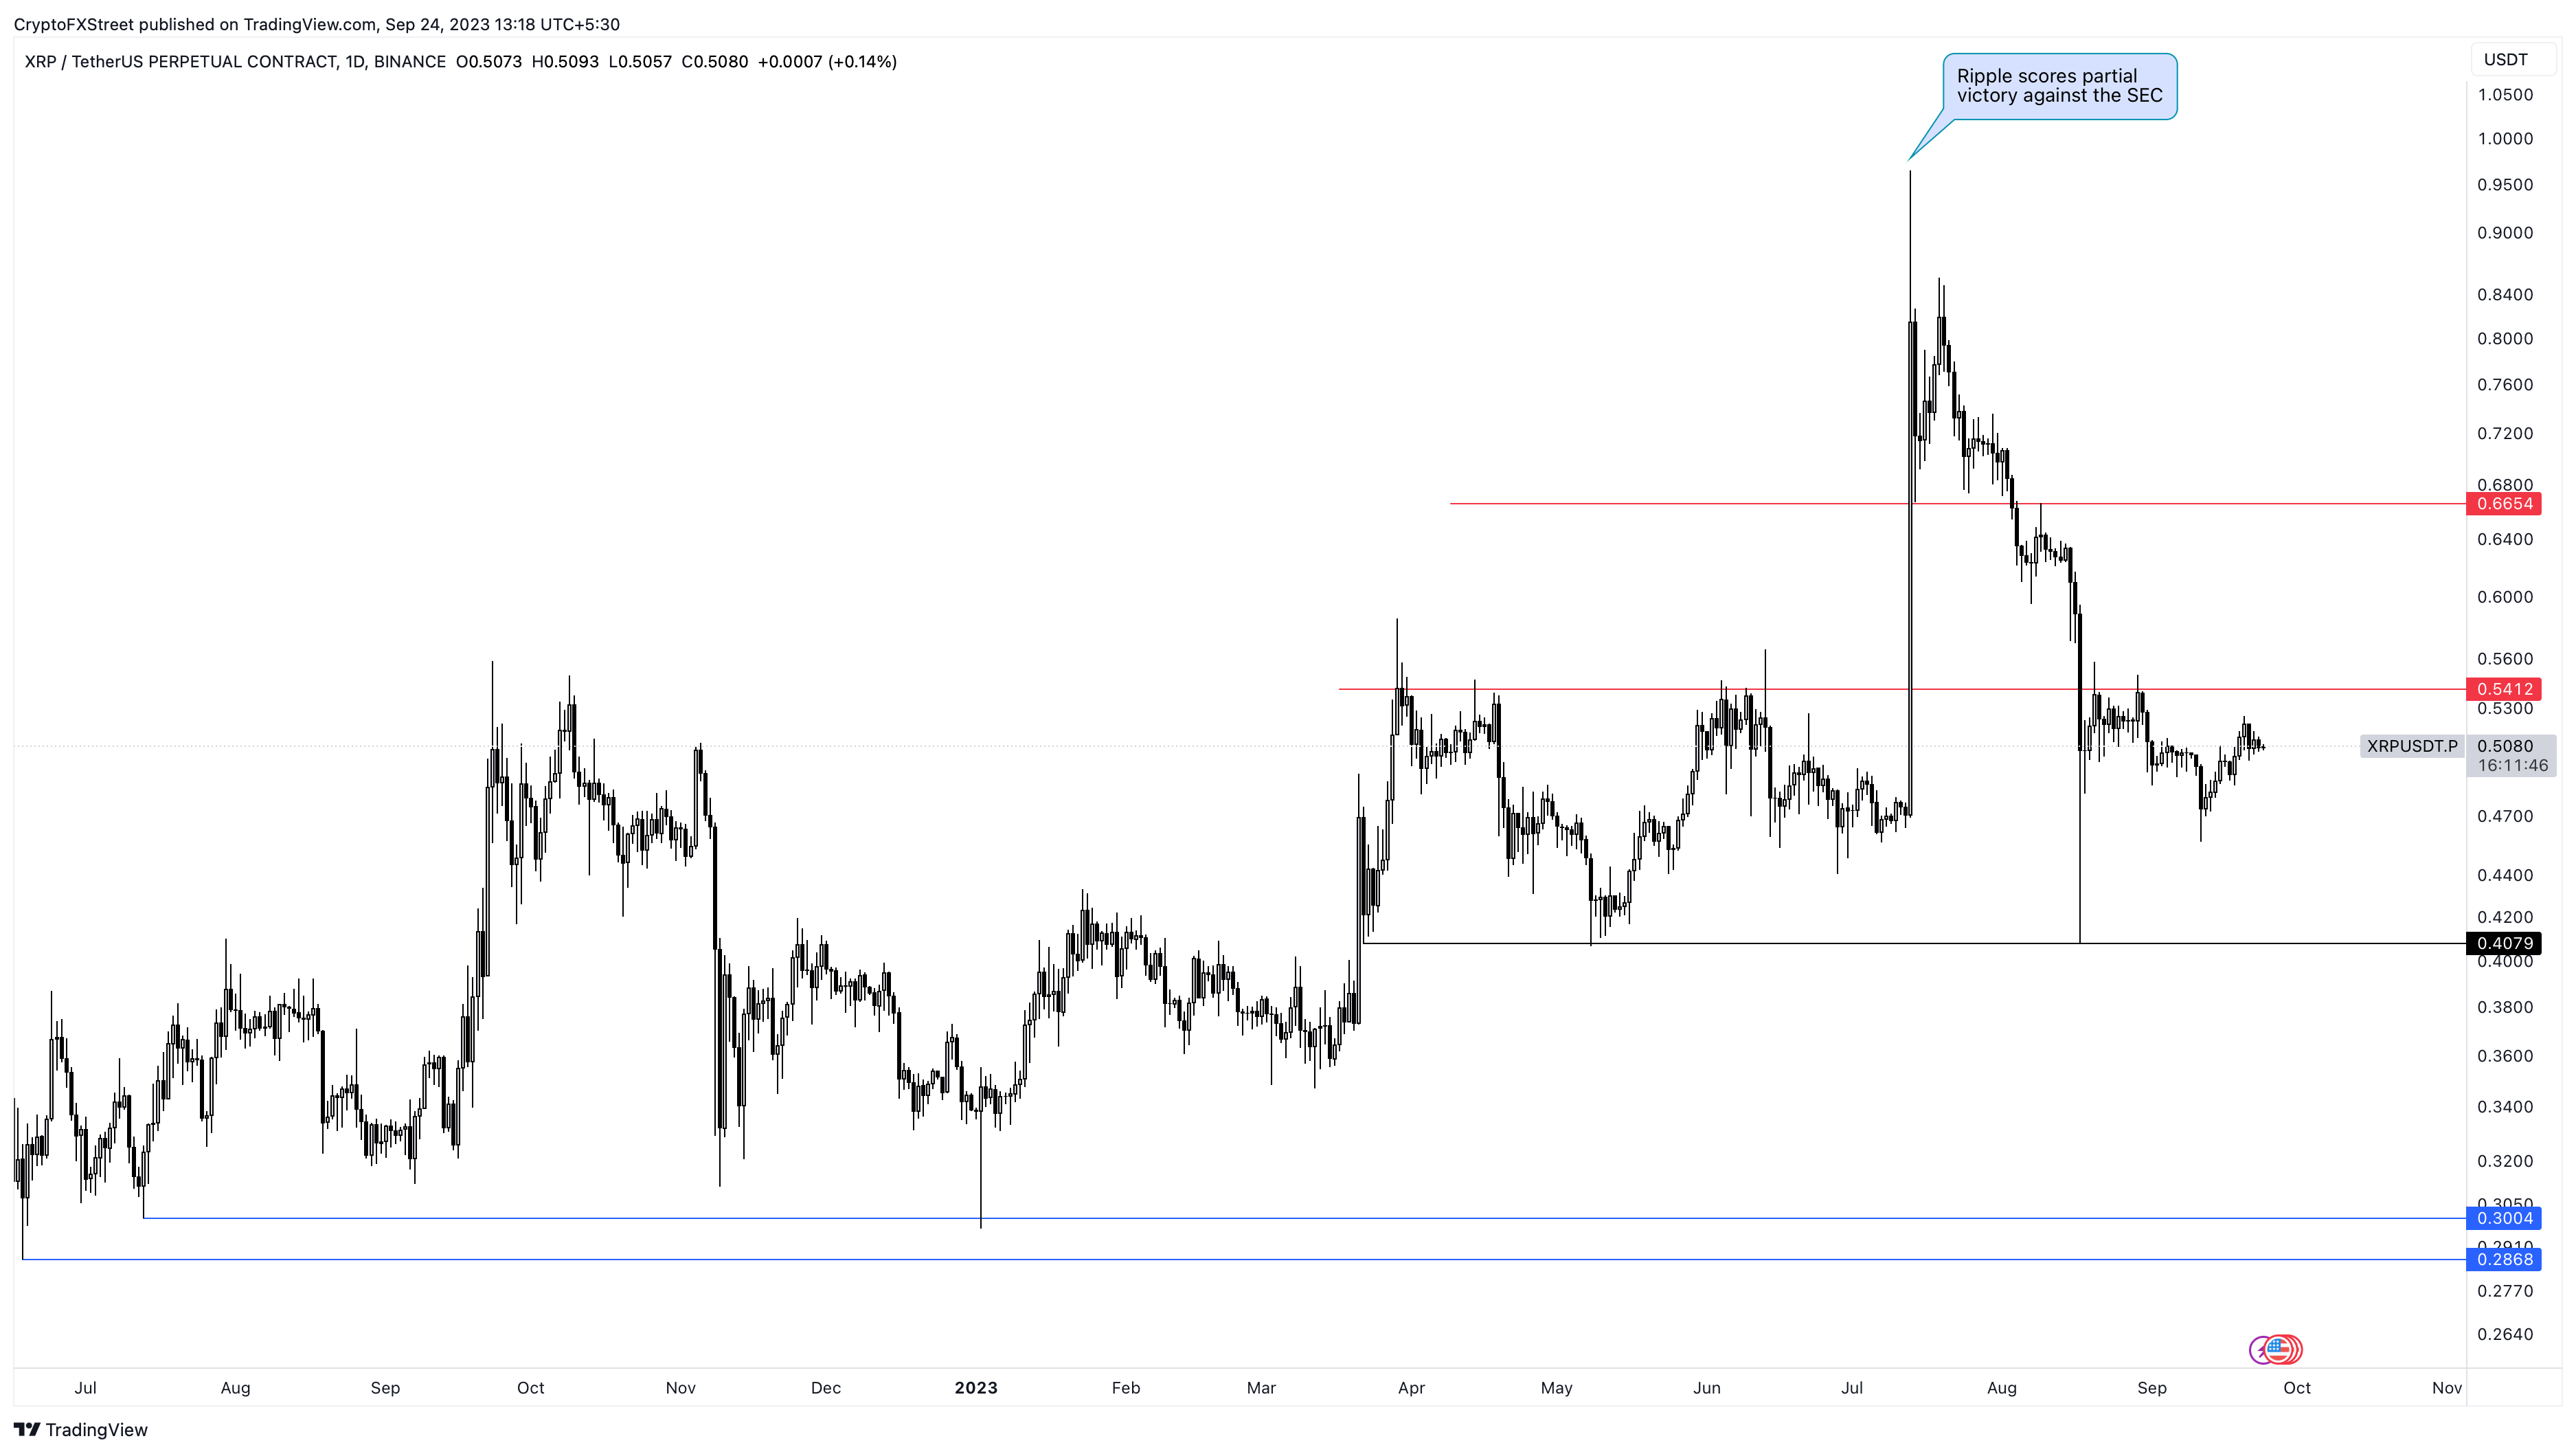
XRP/USDT 1-day chart
Invalidation of the bearish thesis will occur if XRP price flips the $0.541 resistance level into a support floor. In such a case, XRP price could attempt a 23% rally to tag the next key level at $0.665.
Author

Akash Girimath
FXStreet
Akash Girimath is a Mechanical Engineer interested in the chaos of the financial markets. Trying to make sense of this convoluted yet fascinating space, he switched his engineering job to become a crypto reporter and analyst.