Ripple Price Analysis: XRP/USD must break confluence resistance at $0.1967 for lift-off past $0.20
- The resistance at $0.20 delays the symmetrical triangle breakout for XRP/USD.
- A break above the strongest seller congestion zone at $0.1967 could boost Ripple’s rally above $0.20.

Ripple price is among the cryptocurrencies that have remained relatively stable in spite of the bullish wave that swept across the cryptocurrency space towards the end of last week. The price advanced higher from $0.1750 (previous week support) but stalled short of $0.20. At the moment, XRP/USD is trading at $0.1957 after a 1% retreat from the intraday high at $0.1978. The bearish action is not unique to Ripple as Bitcoin and Ethereum have suffered a 1.44% and 1.95% loss respectively.
The daily chart shows Ripple price trading at the apex of a symmetrical triangle. However, the resistance at $0.20 continues to delay an expected breakout. It is essential that the price pulls above the level to keep sellers from gaining traction, resulting in a breakdown under the triangle support. For now, the trend is likely to remain sideways especially with the MACD moving horizontally at the mean line (0.0).
XRP/USD daily chart
 (6)-637236478703828169.png)
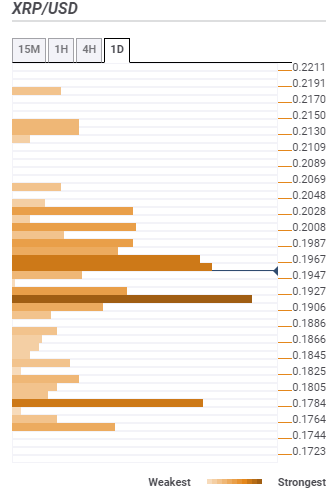
According to the confluence detector tool, the toughest seller congestion lies at $0.1967 and is highlighted by the 50 SMA 15-minutes SMA, SMA 200 15-mins, the previous high 15-mins, the Bollinger Band 1-hour middle among others. It is apparent that a break above this seller zone could boost Ripple above $0.20. Other key confluence resistance areas range from $0.1987 (previous 4-hour high), $0.2008 (previous week high) to $0.2048 (pivot point one-week resistance one).
On the flip side, the main support lies at $0.1927; a region that converges the Fibo 61.8% one-week, the pivot point one-day support two and the Bollinger Band 4-hour upper. The second most significant support area is $0.17894 and is home to the SMA 50 one-day and the previous week low.
Author

John Isige
FXStreet
John Isige is a seasoned cryptocurrency journalist and markets analyst committed to delivering high-quality, actionable insights tailored to traders, investors, and crypto enthusiasts. He enjoys deep dives into emerging Web3 tren


