|

Ripple price analysis: XRP/USD extends the downside correction towards $0.29

  • Ripple is moving within a short-term bearish trend.
  • XRP/USD needs to regain ground above $0.30 to mitigate the bearish pressure.

Ripple’s XRP has been sliding down for the third day in a row. The third digital asset topped at $0.3149 and broke below the ascending trendline from September 23 low. The coin slipped below critical $0.30 as the downside correction has gained traction. Ripple's market value decreased by 1.2% both on a day-to-day basis and since the beginning of the day.  

Let's have a closer look at the technical picture for XRP/USD

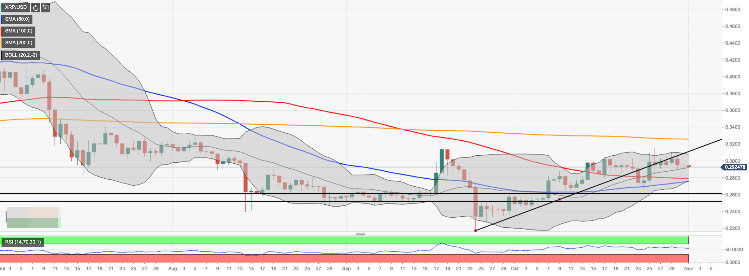
Looking technically, a sustainable move below $0.3000 can be interpreted as a short-term bearish signal. While the price is supported by the middle line of the Bollinger Band daily located on approach to psychological $0.2900, a sustainable move below this handle will take the price to $0.2800 strengthened by SMA100 (Simple Moving Average) daily and $0.2750 (SMA50 coupled with the lower line of the Bollinger Band on a daily chart).

On the upside, we will need to see a sustainable move above $0.30 for the upside to gain traction with the next bullish aim at $0.3070 (the upper line of the daily Bollinger Band) and $0.3110 (the above-mentioned ascending trend line). Once it is out of the way, the bulls will regain control and take the price to $0.3250 (SMA200 daily).

XRP/USD, daily chart

Author

Tanya Abrosimova

Tanya Abrosimova

Independent Analyst


More from Tanya Abrosimova
Share:

Editor's Picks

Ripple bulls defend key support amid waning retail demand and ETF inflows

XRP ticks up above $1.40 support, but waning retail demand suggests caution. XRP attracts $4 million in spot ETF inflows on Thursday, signaling renewed institutional investor interest.

Crypto Today: Bitcoin, Ethereum, XRP rebound as risk appetite improves

Bitcoin rises marginally, nearing the immediate resistance of $68,000 at the time of writing on Friday. Major altcoins, including Ethereum and Ripple, hold key support levels as bulls aim to maintain marginal intraday gains.

Bitcoin Weekly Forecast: No recovery in sight 

Bitcoin price continues to trade sideways between $65,729 and $71,746, extending its consolidation since February 7. US-spot ETFs record an outflow of $403.90 million through Thursday, pointing to the fifth consecutive week of withdrawals.

Pi Network Price Forecast: PI recovery stalls amid profit-taking

Pi Network tests 50-day EMA support on Friday, after a 5% decline the previous day. PiScan data shows large deposits on CEXs totaling over 4 million PI tokens in the last 24 hours, reflecting an exodus of investors taking profits.

Bitcoin Price Annual Forecast: BTC holds long-term bullish structure heading into 2026

Bitcoin (BTC) is wrapping up 2025 as one of its most eventful years, defined by unprecedented institutional participation, major regulatory developments, and extreme price volatility.

Bitcoin: No recovery in sight

Bitcoin (BTC) price continues to trade within a range-bound zone, hovering around $67,000 at the time of writing on Friday, and falling slightly so far this week, with no signs of recovery.