Ripple Price Analysis: XRP/USD consolidates below $0.30 as bulls face resistance at SMA 20
- XRP/USD bulls entered the market following two straight bearish days.
- Elliott Oscillator has had three consecutive red sessions, indicating bearish market sentiment.

XRP/USD daily chart
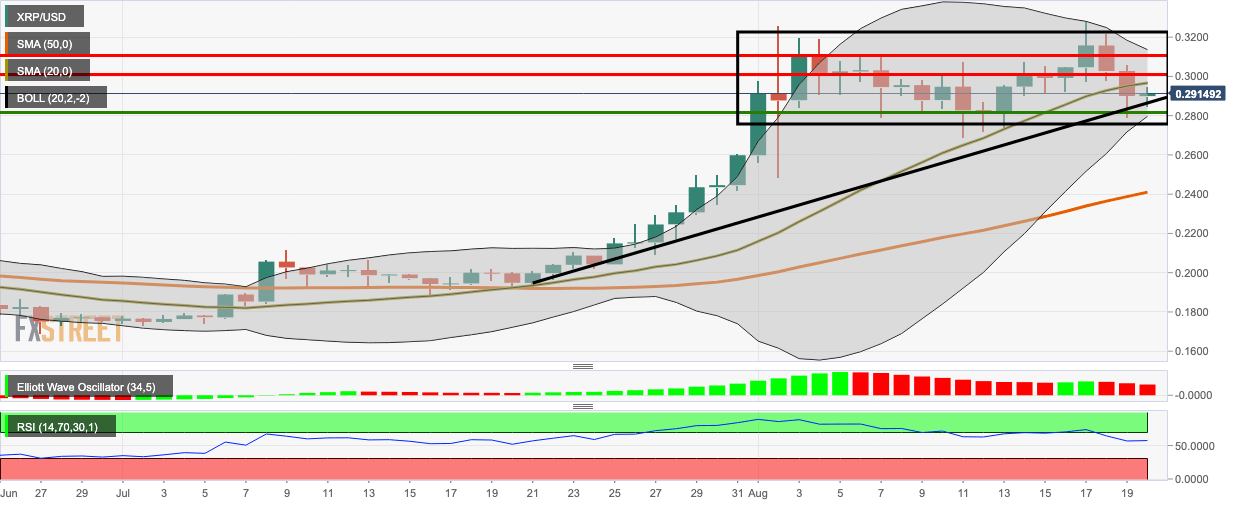
XRP/USD went up from $0.2899 to $0.2911 as the bulls entered the market following two consecutive bearish days. The 20-day Bollinger Band has narrowed down considerably, which shows decreasing price volatility. The Elliott Oscillator has had three straight red sessions, indicating that the overall market sentiment is presently bearish.
The bulls face immediate resistance at $0.296 (SMA 20). Following that, there are two more strong resistance levels at $0.30 and $0.31. On the downside, there is one healthy support level at $0.282. The relative strength index (RSI) is hovering horizontally at 55.38 in the neutral zone.
Key levels
Author

Rajarshi Mitra
Independent Analyst
Rajarshi entered the blockchain space in 2016. He is a blockchain researcher who has worked for Blockgeeks and has done research work for several ICOs. He gets regularly invited to give talks on the blockchain technology and cryptocurrencies.


