|

Ripple Price Analysis: XRP bulls need to crack 200-DMA to extend the recovery

  • XRP/USD looks to extend recovery from two-week lows.
  • 200-DMA is the level to beat for the XRP bulls.
  • Daily RSI edges higher but holds below the midline.

Ripple (XRP/USD) is attempting to build on Friday’s impressive bounce from two-week lows of $0.2400 amid the upbeat sentiment witnessed across the crypto board so far this Saturday.

The no. 5 coin currently trades near $0.2800, adding over 2% on a daily basis. However, it remains on the track to end the week almost unchanged.

The altcoin rose as high as $0.3295 earlier this week following the news of the nomination of Michael Barr, a former US Treasury official and a former key member of Ripple's advisory board, as head of the Office of the Comptroller of the Currency (OCC). 

XRP/USD: Battling 21-DMA on the road to recovery
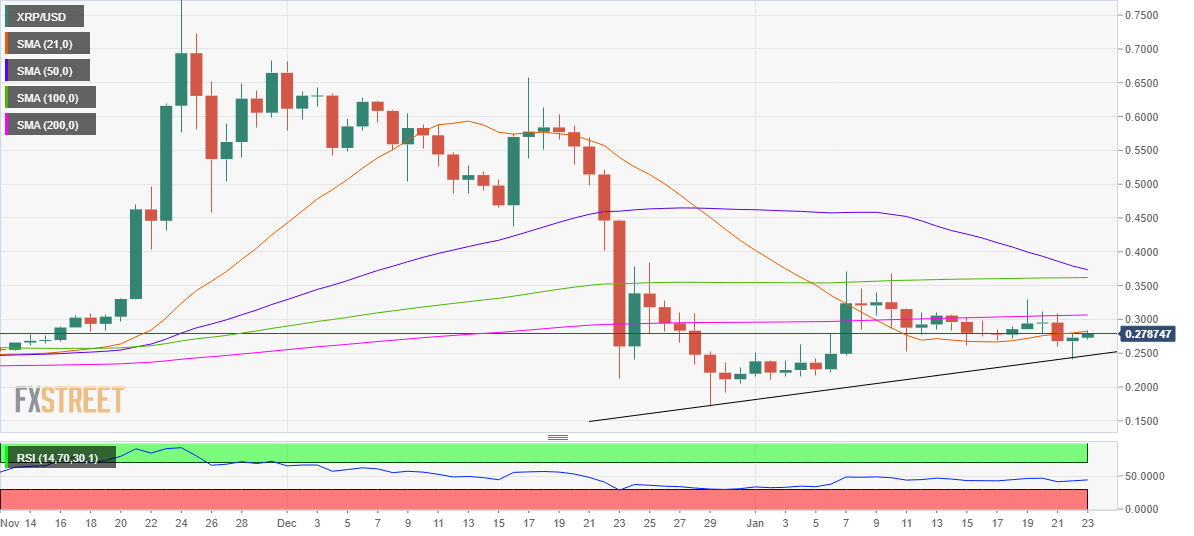
XRP/USD: Daily chart

Ripple’s daily chart shows that the bulls are trying hard to recapture the 21-daily moving average (DMA) at $0.2826, in order to revive the recovery momentum.

However, with the 14-day Relative Strength Index (RSI) still trading within the bearish territory, the XRP bulls lack the conviction for the upside extension.

Acceptance above the 21-DMA could open doors for a test of the critical horizontal 200-DMA at $0.3066, Note that the coin has failed to sustain above the latter since January 10.

A daily close above the 200-DMA barrier is needed to negate the bearish bias.

Alternatively, a rejection at the abovementioned 21-DMA hurdle could expose the three-week-long falling trendline support at $0.2465, below which the two-week troughs will be put to test.

The next best support awaits around $0.2150 while the December 29 low of $0.1719 would be the last line of defense for the bulls.

XRP/USD: Additional levels to consider

XRP/USD

Overview
Today last price0.2782
Today Daily Change0.0046
Today Daily Change %1.68
Today daily open0.273
 
Trends
Daily SMA200.2828
Daily SMA500.379
Daily SMA1000.3616
Daily SMA2000.3061
 
Levels
Previous Daily High0.2785
Previous Daily Low0.24
Previous Weekly High0.3295
Previous Weekly Low0.24
Previous Monthly High0.6817
Previous Monthly Low0.1719
Daily Fibonacci 38.2%0.2638
Daily Fibonacci 61.8%0.2547
Daily Pivot Point S10.2492
Daily Pivot Point S20.2253
Daily Pivot Point S30.2107
Daily Pivot Point R10.2877
Daily Pivot Point R20.3023
Daily Pivot Point R30.3262

Author

Dhwani Mehta

Dhwani Mehta

FXStreet

Residing in Mumbai (India), Dhwani is a Senior Analyst and Manager of the Asian session at FXStreet. She has over 10 years of experience in analyzing and covering the global financial markets, with specialization in Forex and commodities markets.


More from Dhwani Mehta
Share:

Editor's Picks

Crypto Today: Bitcoin, Ethereum, XRP recover ahead of US Senate vote on CLARITY Act

Bitcoin edges higher, trading near $77,884 as of Monday, in tandem with broader gains across the cryptocurrency market. Ethereum and Ripple follow Bitcoin’s neutral-to-bullish trajectory, holding key support levels at $2,521 and $1.38, respectively.

Bitcoin Price Forecast: BTC recovery faces headwinds from ETF outflows and elevated Fed rate-hike bets

Bitcoin is recovering, trading above $78,200 on Monday after a more than 4% pullback the previous week. Elevated Fed rate-hike bets and geopolitical risks are boosting the USD, capping BTC’s upside potential.

Pi Network extends gains as ecosystem development supports recovery

Pi Network (PI) extends its recovery on Monday, trading above $0.097 after two consecutive weeks of gains. Continued ecosystem development and improved developer tools are boosting utility.

Cardano Price Forecast: Hovers near key EMAs as cautious metrics leave rallies exposed to selling

Cardano hovers near the key 50-day and 100-day EMAs around $0.200 on Monday after losses of over 8% in the previous week. The technical outlook suggests that bullish attempts remain vulnerable to selling pressure at higher levels.

Bitcoin: BTC retreats as macro headwinds grow
Bitcoin (BTC) remains under pressure, down over 4% this week and trading around $76,900 at the time of writing on Friday. Institutional demand shows signs of weakness as spot BTC Exchange Traded Funds (ETFs) are on track to end their three-week inflow streak, recording nearly $500 million in net outflows through Thursday.


