|

Ripple Price Analysis: Falling wedge near six-month low probes XRP bears below 0.2400

  • XRP/USD consolidates recent losses after regaining 0.2000 the previous day.
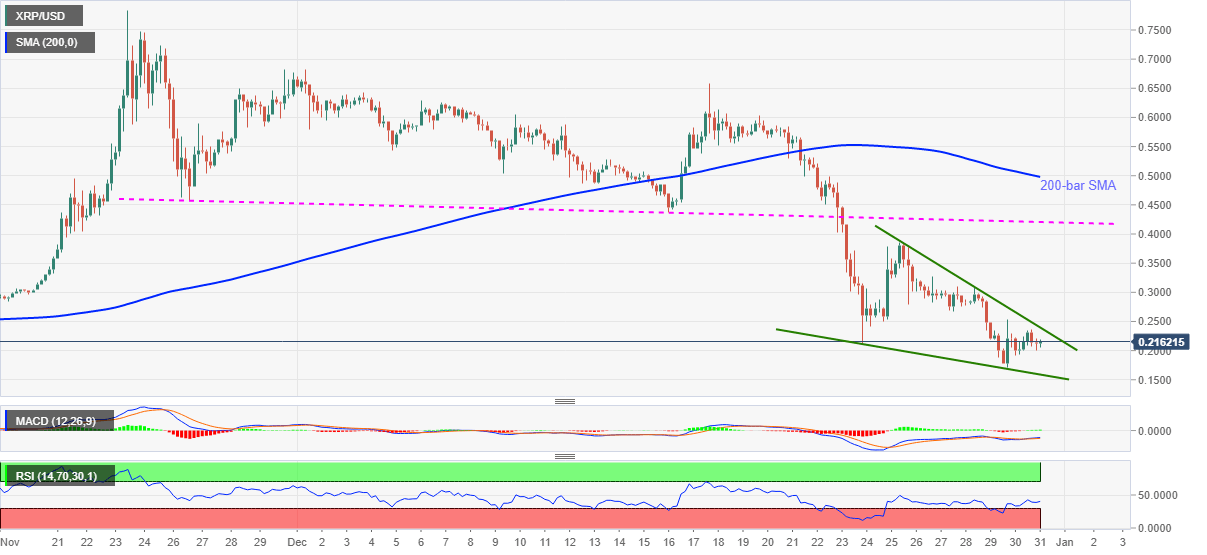
  • Bullish MACD also favors a chart pattern having significance near the bottom.
  • 200-bar SMA, one-month-old falling trend line adds to the upside barriers.

Having recently probed the intraday high near 0.2200, XRP/USD takes rounds to 0.2160, up 2.009% on a day, during the early Thursday. The crypto major recently gained bears’ attention as multiple buses shunned XRP trading.

However, sellers seem to catch a breather following its drop to the lowest since June earlier in the week. The resulted retracement portrays a bullish chart pattern on the four-hour (4H) play.

While wedge has an increased strength to boost the prices when they’re low, XRP/USD’s downtrend to the multi-day bottom keeps the short-term buyers hopeful. Also favoring the upside momentum is the bullish MACD signals.

However, a clear upside break of 0.2400 becomes necessary for the XRP buyers to confirm the bullish chart pattern that favors a return of 0.4500 mark on the chart. Also acting as an upside barrier is the previous support line from November 26, at 0.4208 now.

During the quote’s sustained rise past-0.4208, the 200-bar SMA level of 0.4980 will be the key to watch.

Alternatively, the recent low, also the lowest since June 27, near 0.1720, will precede the stated bullish formation’s support line, currently around 0.1588, to challenge the XRP/USD bears.

Should there be a clear downside past-0.1588, the yearly bottom surrounding 0.1130 and the 0.1000 psychological magnet will gain the market’s attention.

XRP/USD four-hour chart

Trend: Pullback expected

Additional impotant levels

Overview
Today last price0.2163
Today Daily Change0.0048
Today Daily Change %2.27%
Today daily open0.2115
 
Trends
Daily SMA200.4265
Daily SMA500.4633
Daily SMA1000.3545
Daily SMA2000.2955
 
Levels
Previous Daily High0.2364
Previous Daily Low0.1919
Previous Weekly High0.5864
Previous Weekly Low0.2126
Previous Monthly High0.7843
Previous Monthly Low0.228
Daily Fibonacci 38.2%0.2089
Daily Fibonacci 61.8%0.2194
Daily Pivot Point S10.1901
Daily Pivot Point S20.1688
Daily Pivot Point S30.1457
Daily Pivot Point R10.2346
Daily Pivot Point R20.2577
Daily Pivot Point R30.2791

Author

Anil Panchal

Anil Panchal

FXStreet

Anil Panchal has nearly 15 years of experience in tracking financial markets. With a keen interest in macroeconomics, Anil aptly tracks global news/updates and stays well-informed about the global financial moves and their implications.

More from Anil Panchal
Share:

Editor's Picks

Crypto Today: Bitcoin, Ethereum, XRP recovery slows amid incessant capital outflows

The cryptocurrency remains in a broader corrective bias on Friday, despite majors such as Bitcoin (BTC), Ethereum (ETH), and Ripple (XRP) holding slightly higher than early-week support levels.

Cardano: Whale selling, cautious derivatives limit ADA rebound

Cardano is trading near $0.170 at the time of writing on Friday after staging a modest rebound from last week's sharp correction. However, the recovery remains fragile as large holders have resumed reducing their positions, adding fresh selling pressure to ADA.

Experts agree: Bitcoin nears bottom, but weak demand raises doubts

Bitcoin (BTC) is trading above $63,000 at the time of writing on Friday after rebounding from the key 200-week Simple Moving Average (SMA) near $62,000, a level widely viewed as key long-term support.

Pi Network Price Forecast: Bulls attempt comeback as bearish strength fades

Pi Network is trading at around $0.120 on Friday after a modest recovery the previous day. Despite this recent rebound, traders should be cautious as a scheduled unlock of 14.8 million PI tokens on Friday could limit the token's recovery potential by increasing market supply.

Experts agree: Bitcoin nears bottom, but weak demand raises doubts
Bitcoin (BTC) is trading above $63,000 at the time of writing on Friday after rebounding from the key 200-week Simple Moving Average (SMA) near $62,000, a level widely viewed as key long-term support. The recovery may suggest that Bitcoin has found a floor after a sharp correction that spanned more than a month, but some warning signs persist.