|

Ripple Price Analysis: Double top spotted on XRP/USD daily chart

  • Ripple is down nearly 8% for the week.
  • Double top formation on the daily chart points out to a bearish reversal.
  • A daily close below $0.2700 could open the door for further losses. 

Ripple (XRP/USD) gained more than 2% on Saturday but failed to extend its rebound on Sunday. As of writing, XRP/USD was down 2% on the day at $0.2803 and was losing a little more than 8% since the beginning of the week.

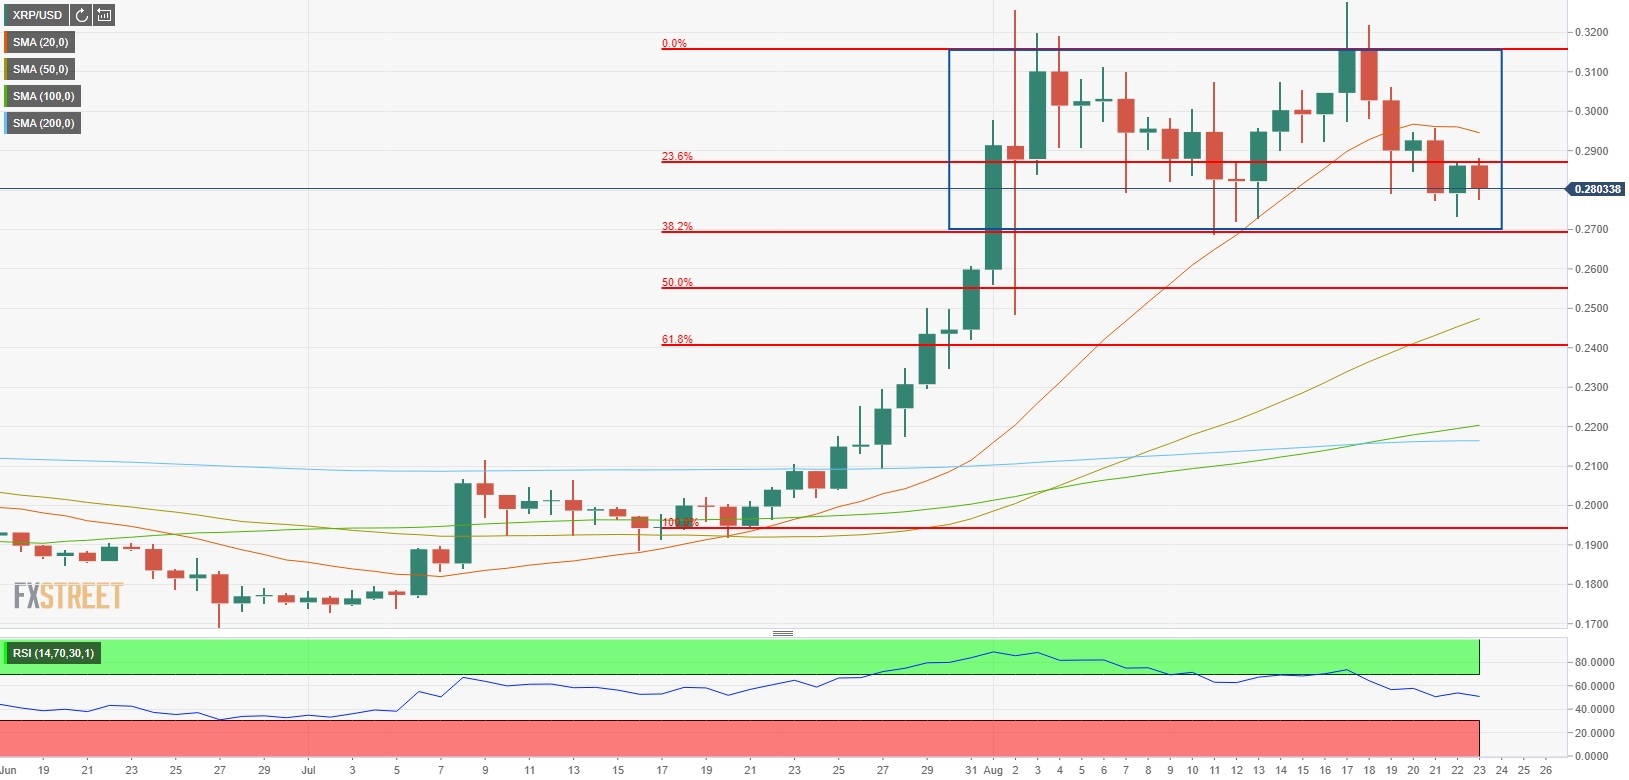
Ripple technical outlook

On the daily chart, a double top formation has become apparent. The bottom line of this formation, which is seen as a bearish reversal sign, is located at $0.2700 (August 11 low, Fibonacci 38.2% retracement of June-August rally) and a daily close below that level could open the door for additional losses. $0.2530 (Fibonacci 50% retracement) and $0.2460 (50-day SMA) could be seen as the next targets on the downside.

Resistances, on the other hand, align at $0.2900 (20-day SMA, Fibonacci 23.6% retracement), $0.3000 (psychological level) and $0.3280 (August 17 high).

Author

Eren Sengezer

As an economist at heart, Eren Sengezer specializes in the assessment of the short-term and long-term impacts of macroeconomic data, central bank policies and political developments on financial assets.

More from Eren Sengezer
Share:

Editor's Picks

XRP pressured by weak ETF flows and declining retail interest

Ripple (XRP) is edging lower, trading above its intraday low of $1.32 at the time of writing on Tuesday. The decline from its weekly opening of $1.39 reflects heightened volatility in the broader cryptocurrency market, accentuated by tariff-triggered uncertainty.

Crypto Today: Bitcoin, Ethereum, XRP come under renewed pressure amid ETF outflows, tariff uncertainty

Bitcoin, Ethereum and Ripple are trading under increasing selling pressure at the time of writing on Tuesday, as market participants navigate renewed tariff uncertainty. The Crypto King holds above $63,000, down 2% intraday from its $64,656 open.

Bitcoin falls to two-week low as ETF outflows, tariff chaos weigh

Bitcoin price extends losses on Tuesday, ending a two-week consolidation phase. Risk-on sentiment fades amid growing uncertainty over Trump’s tariffs and rising US-Iran tensions, increasing downside risks toward $60,000.

Sui Price Forecast: SUI capitulates under pressure, opens the door to $0.70

Sui (SUI) declines by 3% at press time on Tuesday, extending the downside breakout of a short-consolidation range confirmed the previous day. Retail sentiment is bearish, as evidenced by increased long liquidations and a sharp drop in the funding rate. 

Bitcoin Price Annual Forecast: BTC holds long-term bullish structure heading into 2026

Bitcoin (BTC) is wrapping up 2025 as one of its most eventful years, defined by unprecedented institutional participation, major regulatory developments, and extreme price volatility.

Bitcoin: No recovery in sight

Bitcoin (BTC) price continues to trade within a range-bound zone, hovering around $67,000 at the time of writing on Friday, and falling slightly so far this week, with no signs of recovery.