Ripple plans to be the torchbearer of the potential $300 trillion cross-border payment industry
- XRP price observed some increase in the past day but not enough to initiate a recovery rally.
- Until XRP holders begin accumulating again, the chance of a rally akin to the end of October is unlikely.
- The Head of Payments Product at Ripple stated that the company intends to be a large part of the potentially $300 trillion cross-border payment industry.

XRP price is close to taking a break from the active downtrend, but the altcoin still does not have enough bullish momentum to initiate a recovery rally. For the most part, the focus of the parent company Ripple is now on the macro-financial aspect, as evidenced by an executive who stated that the payment processor is eyeing the global cross-border payment industry.
Ripple has its next target
Ripple, which has been a key entity in connecting banks and other financial institutions for conducting instantaneous cross-border payments, is now looking to double down on the same. According to the Head of Payments Product at Ripple, Pegah Soltani, the company intends to revolutionize the cross-border payment sector, potentially using a powered solution.
According to Soltani, the industry has the capability of becoming a $300 trillion sector by 2030, and if Ripple manages to become a crucial part of it, it would unlock immense profits for not just the company but for XRP holders as well.
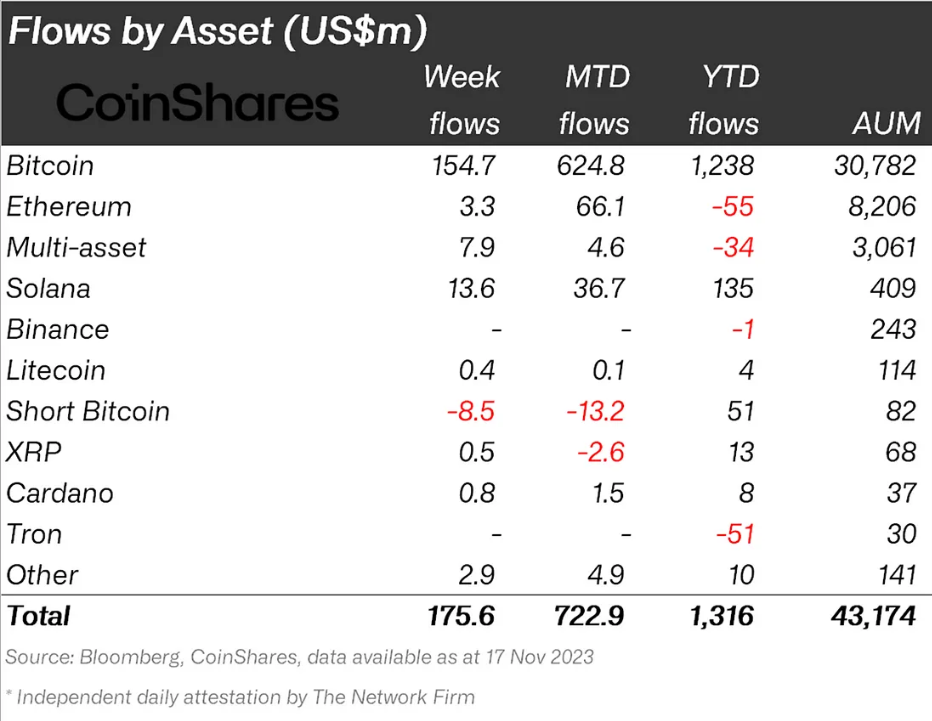
As is, XRP is an important part of institutional investors' holdings. As observed in the Coinshares’ report, for the week ending November 17, XRP bought in over half a million dollars in investment, bringing its month-to-date inflows to $17 million. Consequently, since the beginning of the year, the cryptocurrency has managed to bring in $68 million, which is much higher than the other assets on the list, such as Cardano (ADA), Tron (TRX), etc.
Ripple institutional inflows
This is expected to act as a bullish catalyst for XRP price as well.
XRP price continues to struggle
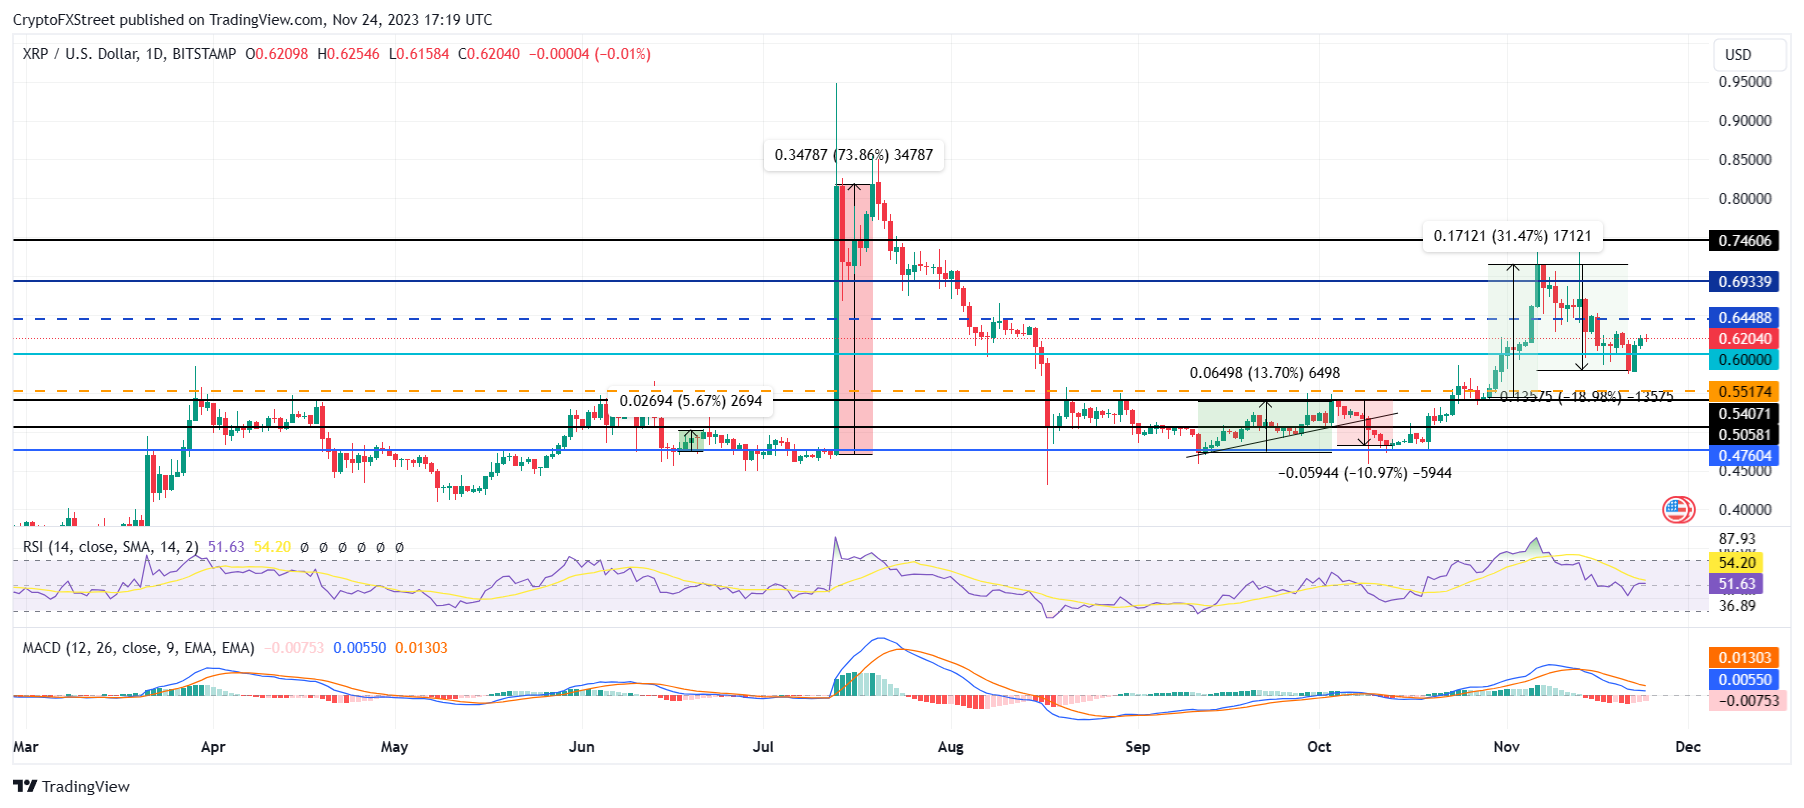
XRP price is likely set to begin a sideways movement, trading at $0.620 at the time of writing. Over the past two weeks, the altcoin has declined by close to 19% but gained slightly in the past 48 hours.
Nevertheless, the larger picture ascertains that until XRP manages to reclaim $0.644 as a support floor, a recovery rally is unlikely. The Moving Average Convergence Divergence (MACD) indicator has also yet to confirm a bullish crossover, as the bars on the histogram are still red, suggesting that the bearishness is waning.
Thus, a retest of $0.644 would prove to be the bullish boost needed for Ripple to initiate a recovery rally and send the XRP price to $0.700.
XRP/USD 1-day chart
However, if the sideways movement continues and XRP fails to produce enough bullishness, it could slip back down to test $0.600 as support. Falling through this line would invalidate the bullish thesis and push the altcoin to $0.551.
Investors need to make a move
By the looks of it, the XRP price is bound to witness sideways movement for a while since the investors are not making a definite move at the moment. Neither are XRP holders willing to sell their assets to book profits or offset losses nor are they trying to accumulate more tokens to instill a sense of bullishness in the market.
This is evident by looking at the Market Value to Realized Value (MVRV) ratio. This indicator is used to assess the average profit/loss of investors who purchase an asset. The 30-day MVRV ratio measures the average profit/loss of investors who purchased an asset in the past month.
For Ripple, when the 30-day MVRV hits 12% to 23%, XRP has undergone major corrections. At this time, investors are likely to sell their holdings to realize profits, which could trigger a sell-off. Hence, this area is termed a danger zone.
Likewise, when the MVRV value hit anywhere between -17% and -32%, it was often followed by rallies. Hence, this area is termed an “opportunity zone” and an ideal place for accumulation.
 [22.43.58, 24 Nov, 2023]-638364666121489590.png)
Ripple MVRV ratio
But since XRP has missed hitting either zone during the recent rally and correction, investors are likely going to refrain from making a move until they witness clearer signs. Thus, Ripple will most likely have to wait for either accumulation or selling and consequently continue moving sideways for a while.
Cryptocurrency metrics FAQs
What is circulating supply?
The developer or creator of each cryptocurrency decides on the total number of tokens that can be minted or issued. Only a certain number of these assets can be minted by mining, staking or other mechanisms. This is defined by the algorithm of the underlying blockchain technology. Since its inception, a total of 19,445,656 BTCs have been mined, which is the circulating supply of Bitcoin. On the other hand, circulating supply can also be decreased via actions such as burning tokens, or mistakenly sending assets to addresses of other incompatible blockchains.
What is market capitalization?
Market capitalization is the result of multiplying the circulating supply of a certain asset by the asset’s current market value. For Bitcoin, the market capitalization at the beginning of August 2023 is above $570 billion, which is the result of the more than 19 million BTC in circulation multiplied by the Bitcoin price around $29,600.
What is trading volume?
Trading volume refers to the total number of tokens for a specific asset that has been transacted or exchanged between buyers and sellers within set trading hours, for example, 24 hours. It is used to gauge market sentiment, this metric combines all volumes on centralized exchanges and decentralized exchanges. Increasing trading volume often denotes the demand for a certain asset as more people are buying and selling the cryptocurrency.
What is funding rate?
Funding rates are a concept designed to encourage traders to take positions and ensure perpetual contract prices match spot markets. It defines a mechanism by exchanges to ensure that future prices and index prices periodic payments regularly converge. When the funding rate is positive, the price of the perpetual contract is higher than the mark price. This means traders who are bullish and have opened long positions pay traders who are in short positions. On the other hand, a negative funding rate means perpetual prices are below the mark price, and hence traders with short positions pay traders who have opened long positions.
Author

Aaryamann Shrivastava
FXStreet
Aaryamann Shrivastava is a Cryptocurrency journalist and market analyst with over 1,000 articles under his name. Graduated with an Honours in Journalism, he has been part of the crypto industry for more than a year now.


