Reserve Rights Price Prediction: A 30% rally lies ahead
- Reserve Rights price is breaking above the descending trendline, signals a bullish move ahead.
- On-chain data shows RSR's open interest is rising, indicating an influx of new money.
- A daily candlestick close below $0.0038 would invalidate the bullish thesis.

Reserve Rights (RSR) price is breaking above the descending trendline and trades higher by 3.6% on Wednesday. On-chain data shows that RSR's open interest is rising, indicating an influx of new money and a rally in RSR prices in the coming days.
Reserve Rights price shows potential for a rally after breaking above the descending trendline
Reserve Rights price is breaking above the descending trendline drawn by joining multiple swing high levels from March 26. At the time of writing, trades higher by 3.6% at $0.0054 on Wednesday.
If RSR breaks above the descending trendline and closes above the daily resistance at $0.0058, it could rally 33% to retest the June 12 high of $0.0078.
The Relative Strength Index (RSI) and the Awesome Oscillator (AO) on the daily chart trade above their neutral levels of 50 and zero, respectively. These momentum indicators strongly indicate bullish dominance.
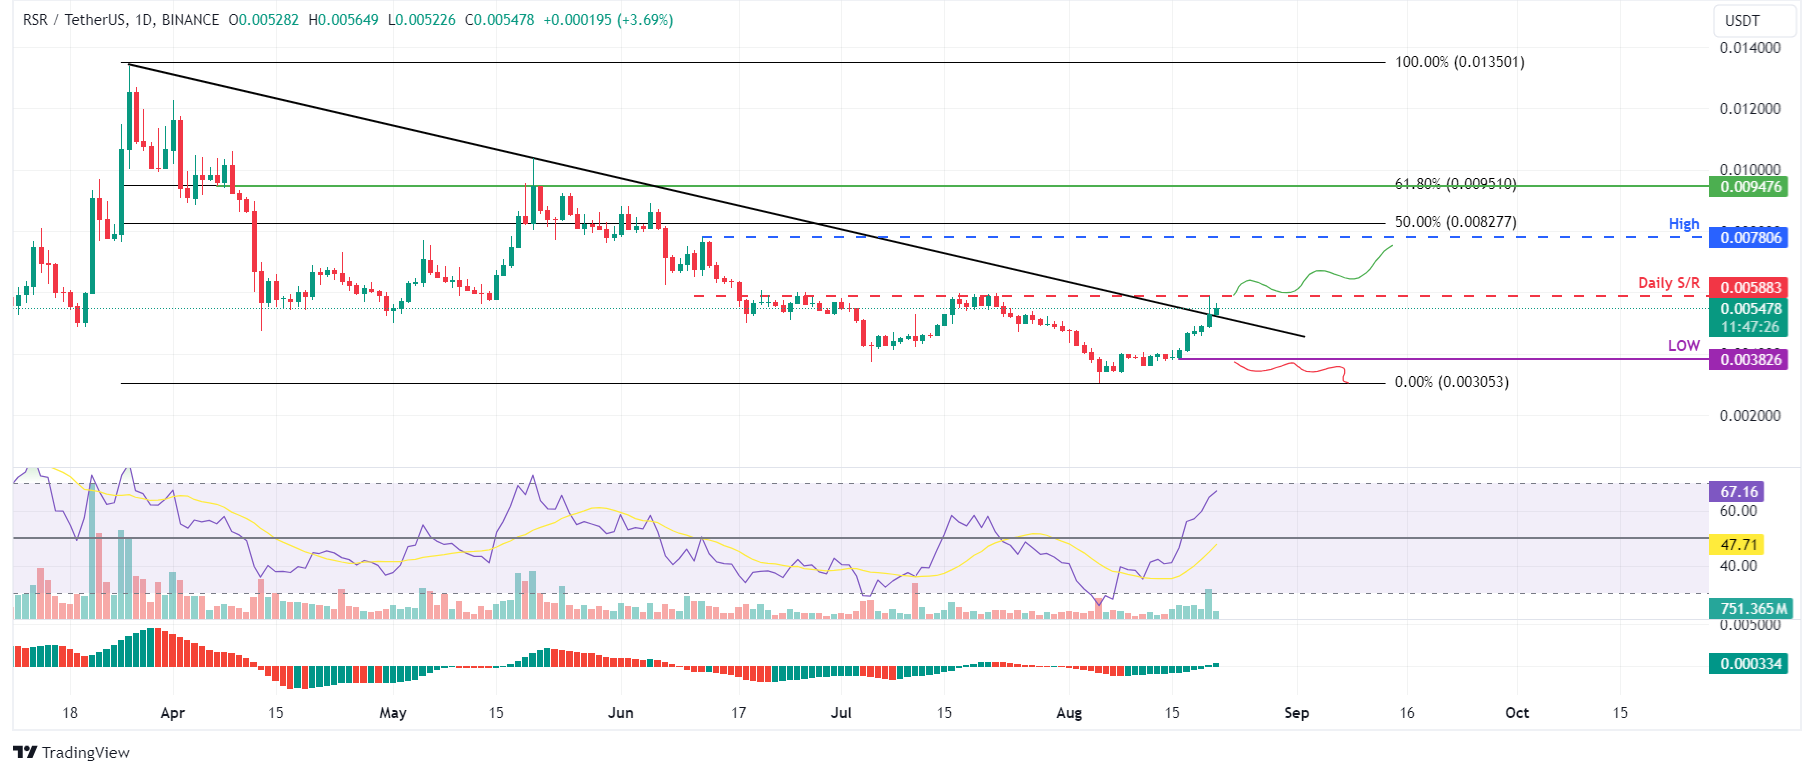
RSR/USDT daily chart
Based on IntoTheBlock's In/Out of the Money Around Price (IOMAP), nearly 318 addresses accumulated 1.16 billion RSR tokens at an average price of $0.0053. These addresses bought the RSR token between $0.0052 and $0.0053, which makes it a key support zone.
Interestingly, the zone mentioned from a technical analysis perspective, the $0.0053 level, coincides with the IOMAP findings, making this zone a key reversal area to watch.
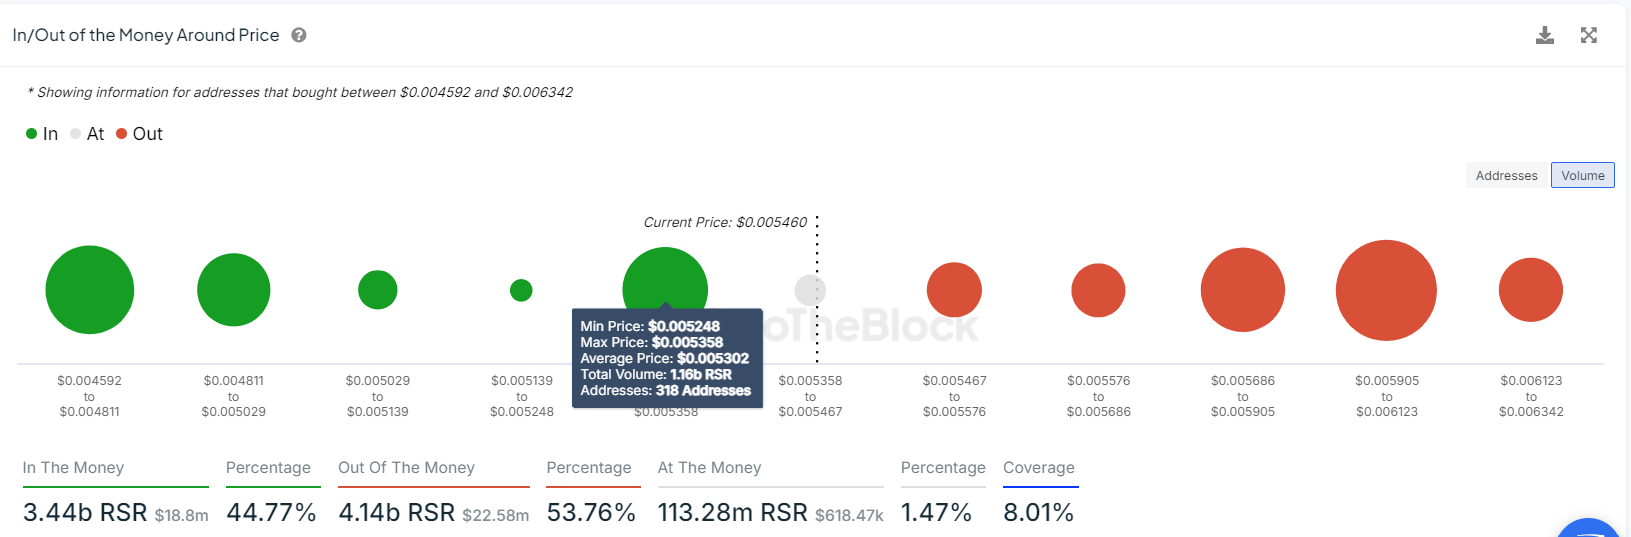
RSR IOMAP chart
Data from CoinGlass shows that the futures' Open Interest (OI) in Reserve Rights at exchanges is also increasing. The OI indicates the total number of outstanding derivative contracts that have not been settled (offset by delivery) and whether money flows into the contract are increasing or decreasing.
Increasing OI represents new or additional money entering the market and new buying, which suggests a bullish trend. When OI decreases, it is usually a sign that the market is liquidating, more investors are leaving, and the current price trend is ending.
The graph below shows that RSR's OI increased from $10.81 million on Tuesday to $12.88 million on Wednesday, indicating that new or additional money is entering the market and new buying is occurring.
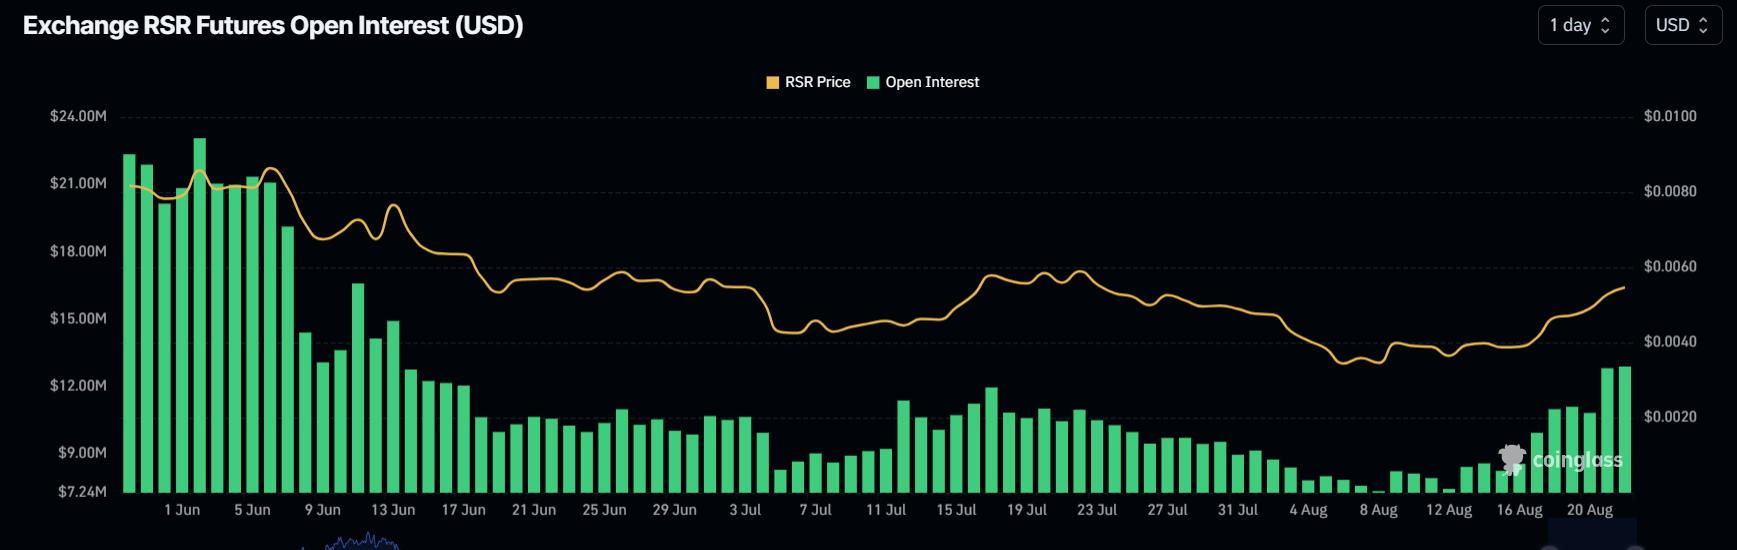
RSR Open Interest chart
Despite the bullish thesis signaled by both on-chain data and technical analysis, the outlook will shift to bearish if Reserve Rights's daily candlestick closes below $0.0038. This scenario could lead to a 20% crash to retest its low of $0.0030 on August 5.
Author

Manish Chhetri
FXStreet
Manish Chhetri is a crypto specialist with over four years of experience in the cryptocurrency industry.


