|

Polkadot Price Prediction: DOT shows good signs of new all-time highs

  • Polkadot price is contained inside a descending parallel channel on the daily chart.
  • The digital asset faces one critical resistance level before a potential 20% breakout.
  • DOT is only 10% away from new all-time highs above $42.2 as the entire market turns green.

Polkadot had several significant breakouts in the past week, gaining 40% since March 24. The digital asset is on the path of new all-time highs with just one key resistance level ahead.

Polkadot price must climb above this trendline to see $40

On the daily chart, Polkadot has established a descending parallel channel with the upper boundary established at about $37.5. The digital asset is on the verge of cracking this point after forming a new daily uptrend.
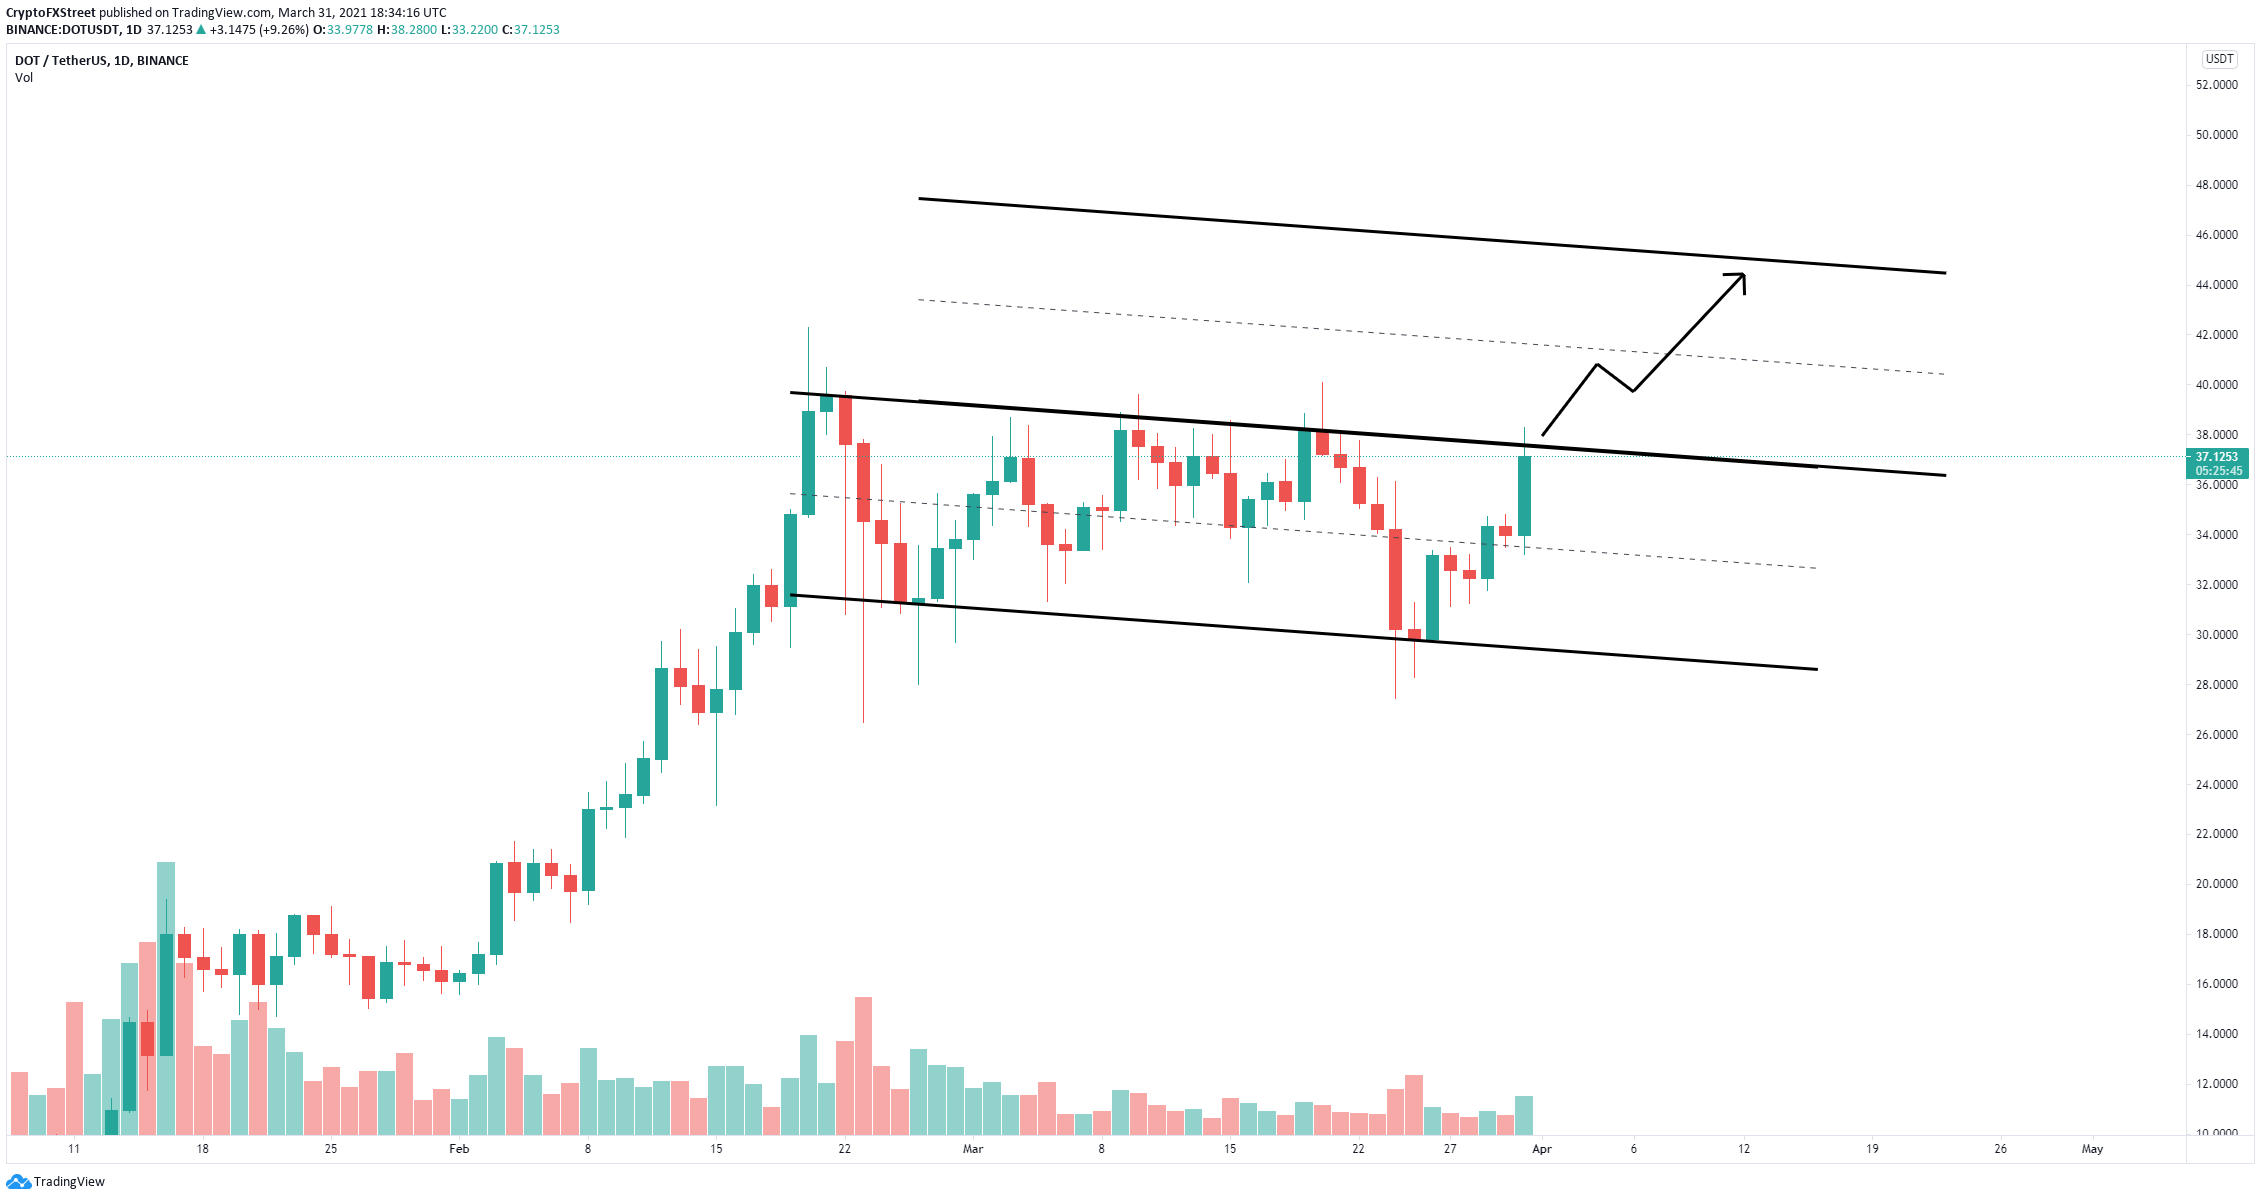
dot price

DOT/USD daily chart

As there aren't other essential resistance levels ahead, a breakout above $37.5 should quickly drive Polkadot price towards the previous all-time high of $42.28 and as high as $45 in the longer-term. 

Nonetheless, a rejection from the upper trendline resistance of the parallel channel would be notable, with the potential to push Polkadot price down to at least the middle trendline at $33.3 and as low as $29.

Author

Lorenzo Stroe

Lorenzo Stroe

Independent Analyst

Lorenzo is an experienced Technical Analyst and Content Writer who has been working in the cryptocurrency industry since 2012. He also has a passion for trading.

More from Lorenzo Stroe
Share:

Editor's Picks

Ripple extends losses as derivatives interest cools

Ripple (XRP) extends its bearish roll near $1.12 support on Friday, reflecting intense headwinds in the broader crypto market largely attributable to macroeconomic pressure.

Crypto Today: Bitcoin, Ethereum, XRP weaken further as capital outflows persist

Macroeconomic headwinds continue to weigh heavily on the cryptocurrency market on Friday, prompting major assets like Bitcoin (BTC) to pare earlier gains and extend losses after June’s brief relief rally.

Bitcoin Weekly Forecast: Recovery hopes fade after the Fed spoils the party

Bitcoin is set to end the week in the red, trading near the 200-Week Simple Moving Average at around $62,300 on Friday. Institutional selling persists, capping BTC’s recovery as spot Exchange Traded Funds point to a sixth consecutive week of outflows.

Sui risks a deeper bearish leg despite on-chain resilience

Sui is down 2% on Friday, extending its decline toward the recent support leg formed at $0.6618. The Total Value Locked in the Sui ecosystem has stabilized around 600 million SUI tokens, reflecting resilient user demand.

Bitcoin: Recovery hopes fade after the Fed spoils the party
Bitcoin (BTC) is set to end the week in the red, trading near the 200-Week Simple Moving Average (SMA) at around $62,300 on Friday. Institutional selling persists, capping BTC’s recovery as spot Exchange Traded Funds (ETFs) point to a sixth consecutive week of outflows.