Polkadot price looks unstoppable as it marches towards $100
- Polkadot price action is close to completing the first clear bullish reversal in over five months.
- DOT remains one of the most lagging major market cap cryptocurrencies.
- Major bullish reversal Point and Figure pattern still in play.

Polkadot price action has consolidated significantly over the past three sessions. The bodies of the Monday, Tuesday, and Wednesday candlesticks show DOT stuck between the $21.20 and $22.50 value areas.
Polkadot price consolidation is likely a precursor to a major bullish breakout
Polkadot price continues to have one of the longest-lasting Spike Patters on its Point and Figure chart of the entire cryptocurrency market. The beginning of current O-column was first developed on November 3, 2021. Since November 3, 2021, DOT has yet to have a reversal column of Xs develop. Although no time factor exists on a Point and Figure chart, the length of time without a reversal is notable and considerable.
A Spike Pattern is any column with fifteen or more Xs or Os. It represents extremes and overdone movements. The entry off of a Spike Pattern is the three-box reversal. Compared to other patterns in Point and Figure analysis, the Spike Pattern requires active management and is a more aggressive entry.
The theoretical long entry opportunity for Polkadot price is a buy stop order at $24, a stop loss at $16, and a profit target at $100. The profit target is derived from the Vertical Profit Target Method in Point and Figure analysis and should not be viewed as a target likely to get hit anytime soon.
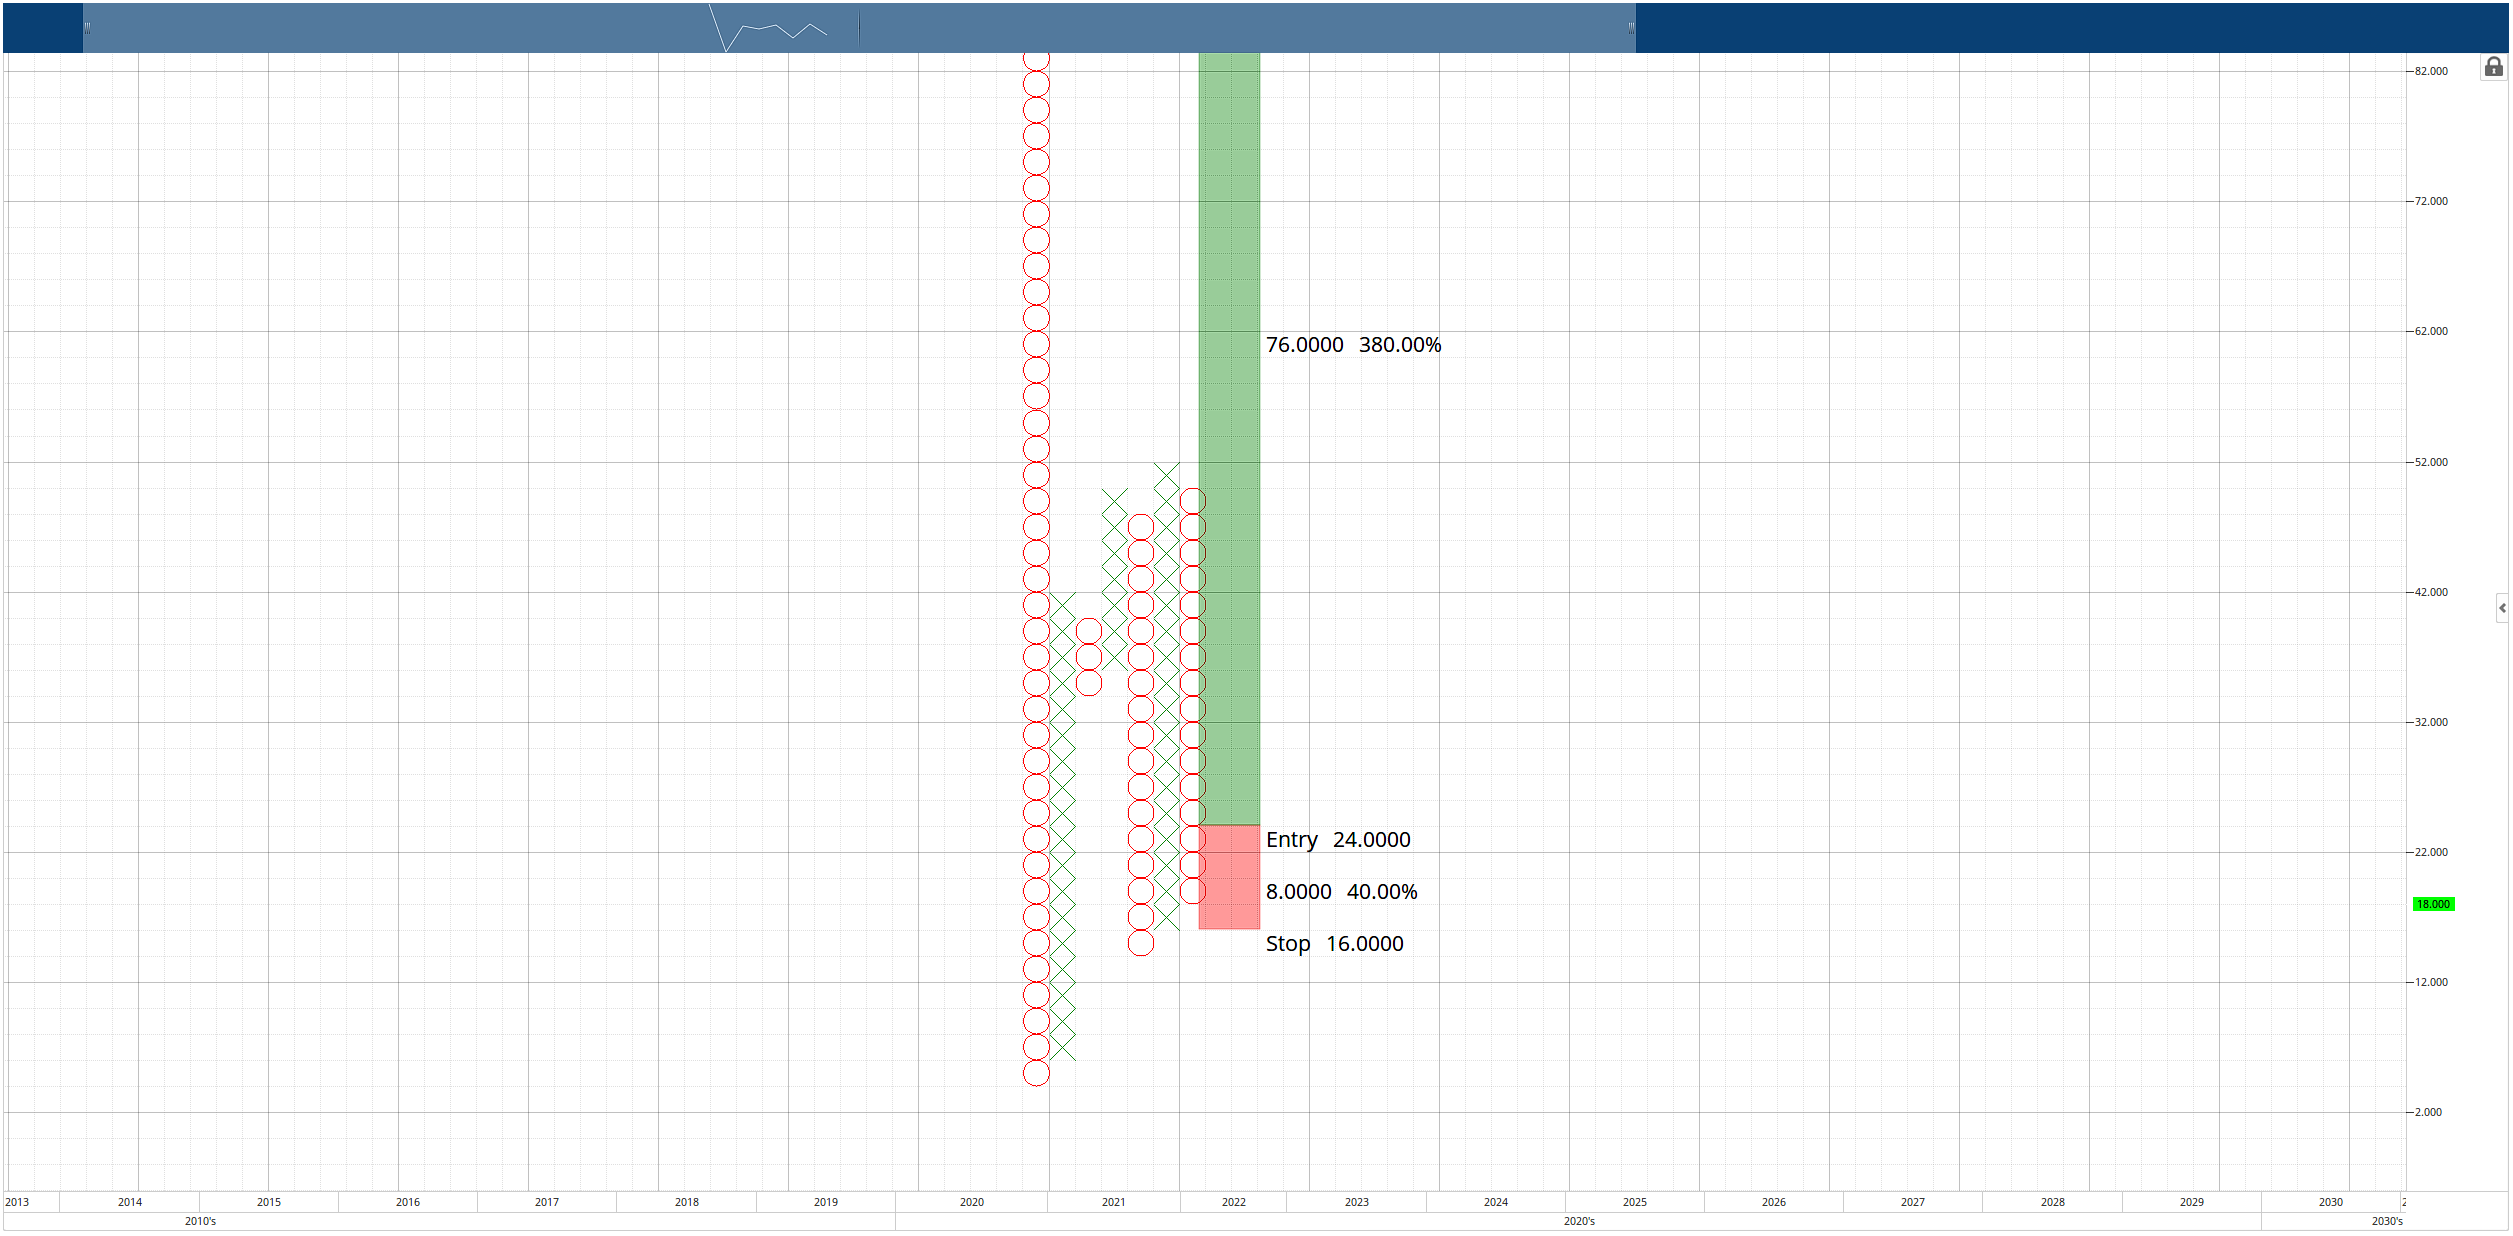
DOT/USD $2.00/3-box Reversal Point and Figure Chart
Additionally, because it is a Spike Pattern, the low of the current O-column is not known. Therefore, if Polkadot price moves lower, the entry and four-box stop loss move in tandem with price.
Downside risks remain a concern and are likely limited to the 2022 lows near the $17 value area.
Author

Jonathan Morgan
Independent Analyst
Jonathan has been working as an Independent future, forex, and cryptocurrency trader and analyst for 8 years. He also has been writing for the past 5 years.


