Polkadot price faces potential rejection at a critical resistance level
- DOT price is up by 16% in the past 48 hours following the lead of Bitcoin.
- The digital asset could be facing a notable rejection as the TD Sequential indicator is on the verge of presenting a sell signal.

Polkadot had a massive rally towards $6.86 on September 1, shortly after getting listed on major exchanges and reaching a multi-billion market capitalization. Since then, DOT’s price has declined by 34% trading sideways for the past month.
DOT shows signs of a short-term reversal
On the 4-hour chart, the price of DOT has climbed above the three SMAs, but it’s facing a potential sell signal which could be presented by the TD Sequential indicator in the next hour. The indicator is already showing a green ‘8’ which is usually followed by the green ‘9’ sell signal.
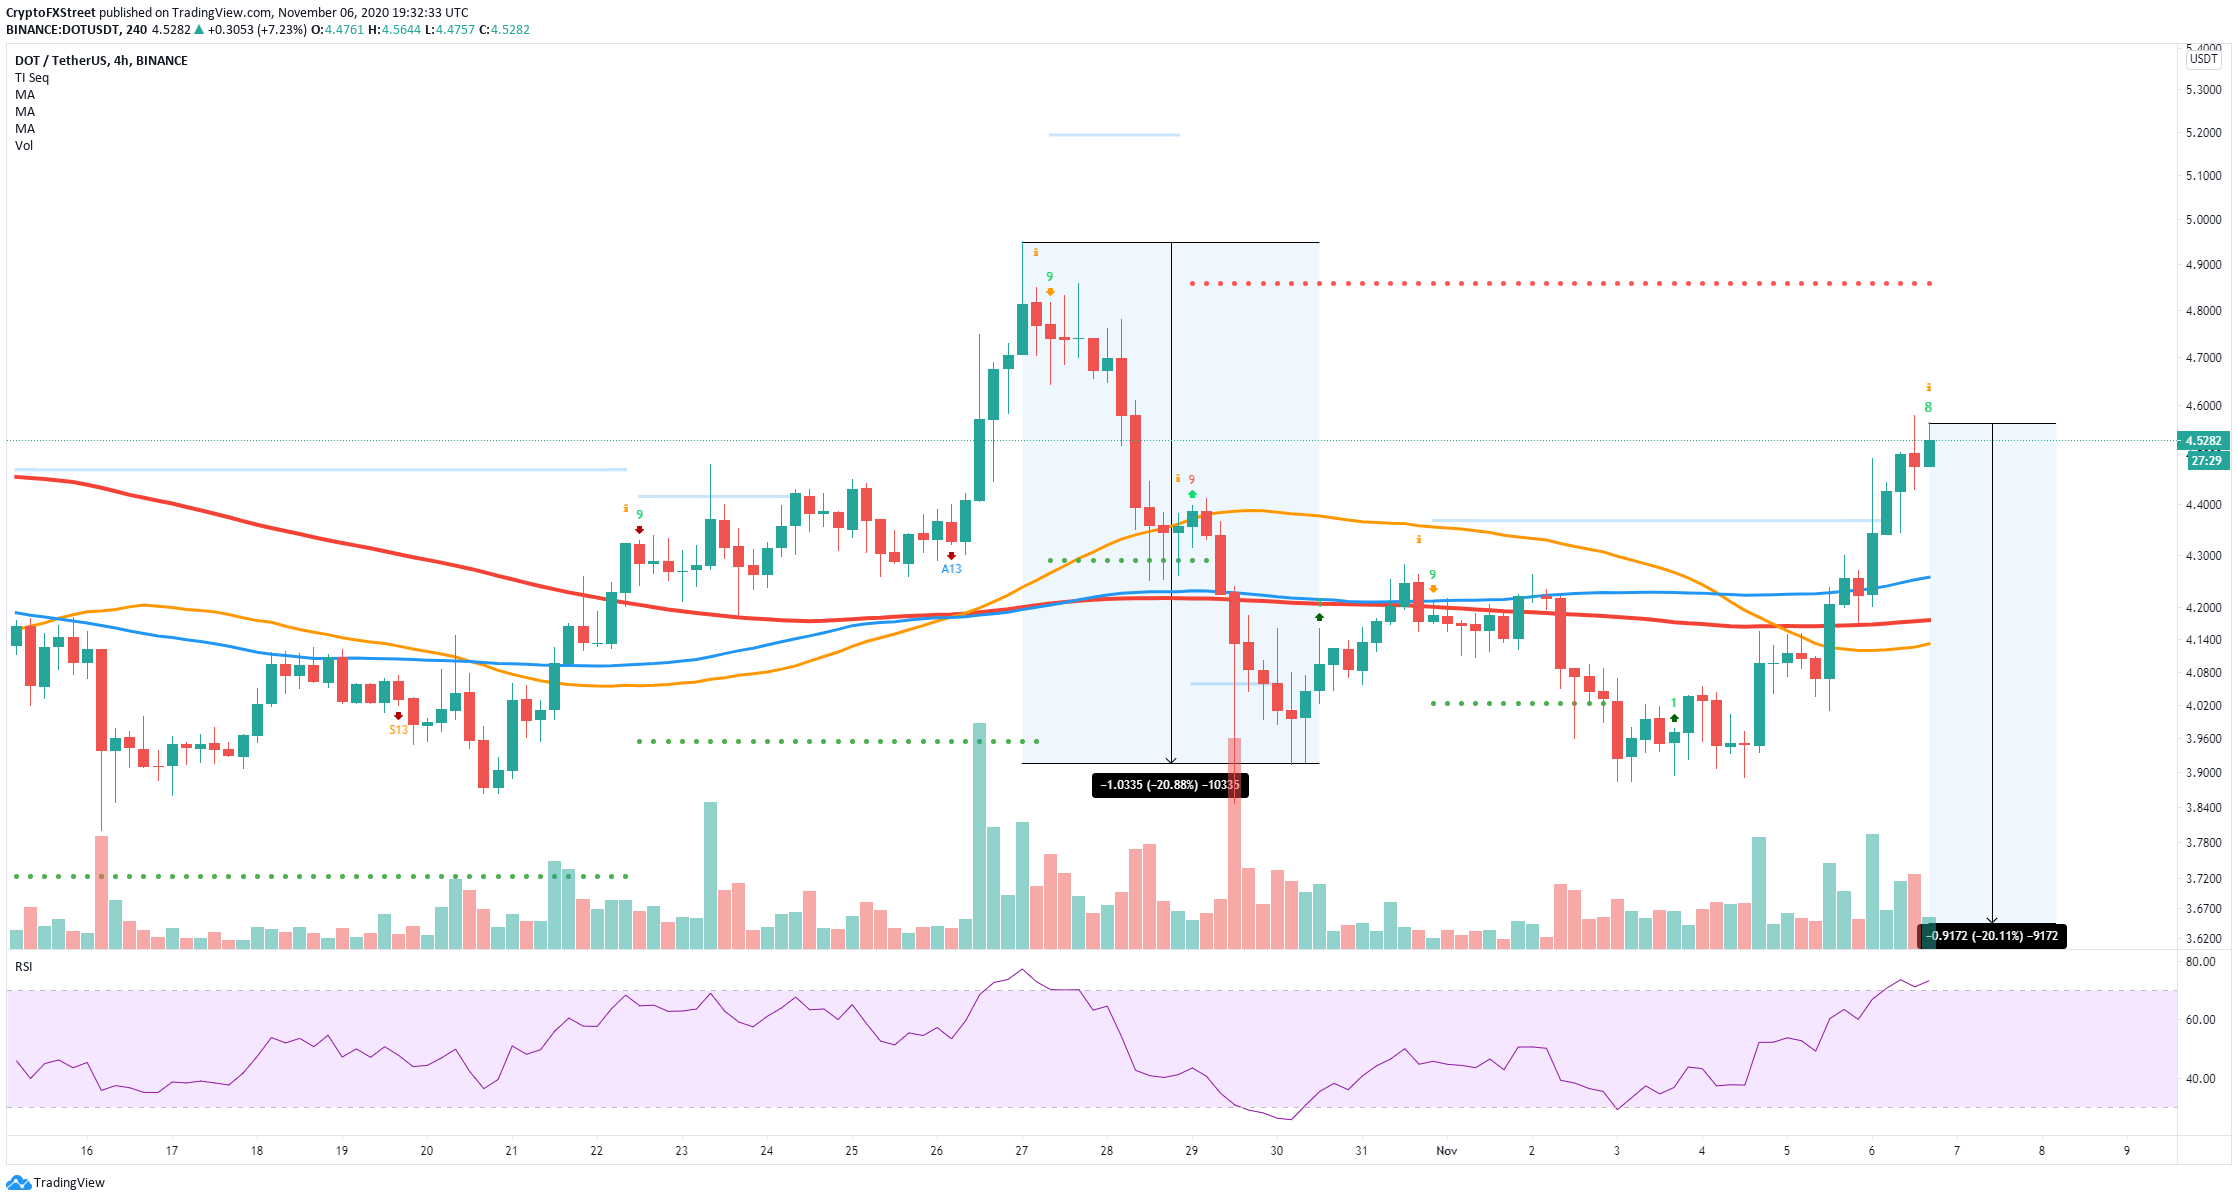
DOT/USD 4-hour chart
On top of that, the RSI is also overextended for the first time since October 26. If history repeats, we could see another 20% drop for DOT, taking the digital asset towards $3.64 as the lowest price target. The Fibonacci retracement indicator shows another potential price target at $4.2, the 50% Fib.
-637402880389425175.png)
DOT/USD 4-hour chart
It’s worth noting that a breakout above the resistance level at $4.621, the 0.236 Fib, will invalidate the sell signal and push the price of DOT towards $4.95, the high established on October 27.
Author

Lorenzo Stroe
Independent Analyst
Lorenzo is an experienced Technical Analyst and Content Writer who has been working in the cryptocurrency industry since 2012. He also has a passion for trading.


