Polkadot Technical Analysis: DOT bears tighten their hold, price aims for $4
- DOT/USD has been on a downtrend after charting the evening star pattern.
- The 4-hour chart has flashed the buy signal with a red-nine candlestick in the TD sequential indicator.

Polkadot has had three consecutive bearish days after encountering resistance at the $4.70 barrier. In the process, DOT managed to break below the 50-day SMA and is currently priced at $4.35. The sellers are looking to aim for the $4 support wall. A break below that will take the “Ethereum killer” to the $3.75 support level. The MACD also shows decreasing bullish momentum following the recent bearish price action.
DOT/USD daily chart

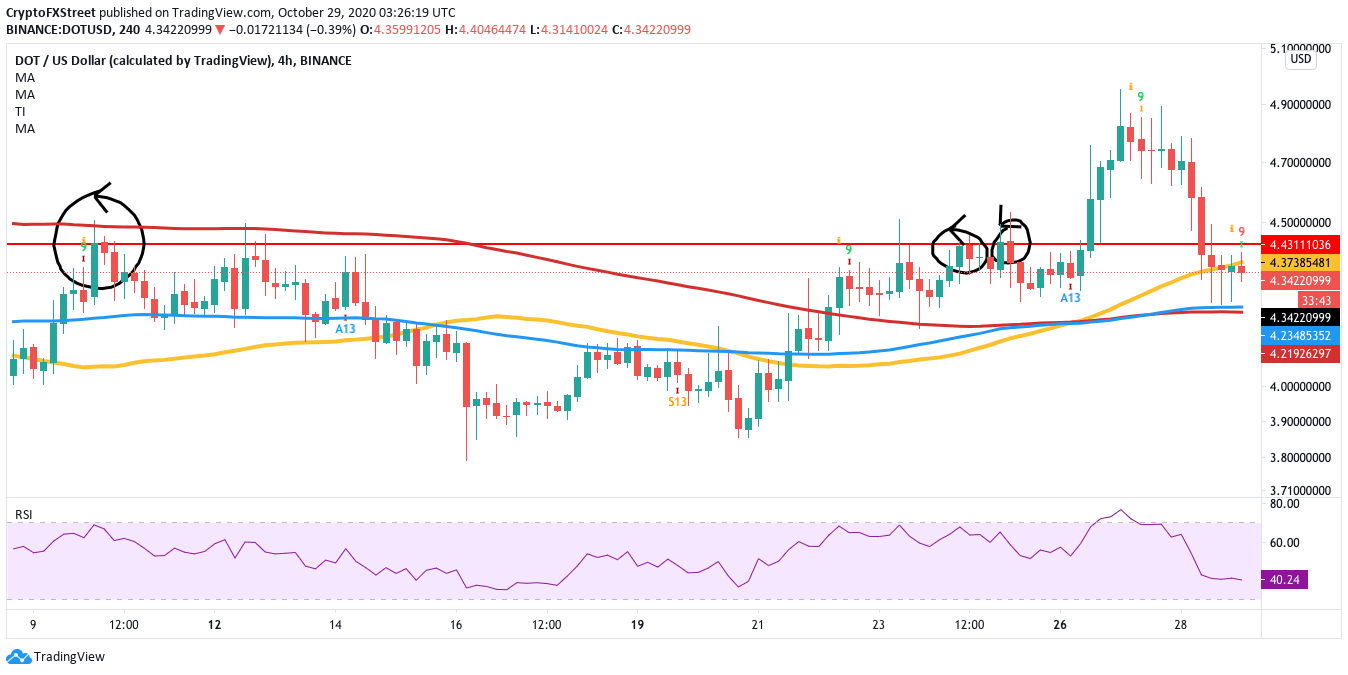
The Flipside: Bulls to launch a short-term fight back?
While the overall outlook seems bearish, it looks like the buyers could be gearing for a short-term fightback. The 4-hour chart has flashed a buy signal in the TD sequential indicator with a red-nine candlestick. Currently, the price faces resistance at the 50-bar SMA ($4.35). Breaking above this obstacle will take the price up to the $4.45 resistance line, which has previously thwarted the price multiple times.
DOT/USD 4-hour chart
Key price levels to watch
DOT bears will aim to take the price down to the $4 support wall. A break below that will take the price down to the $3.75 support line.
The bulls will try to take control in the short term and break above the 50-bar SMA ($4.35) in the 4-hour chart. Following that, they will aim to take the DOT up to the $4.45 resistance.
Author

Rajarshi Mitra
Independent Analyst
Rajarshi entered the blockchain space in 2016. He is a blockchain researcher who has worked for Blockgeeks and has done research work for several ICOs. He gets regularly invited to give talks on the blockchain technology and cryptocurrencies.


