|

Polkadot price at a do-or-die scenario on the verge of a massive 34% move

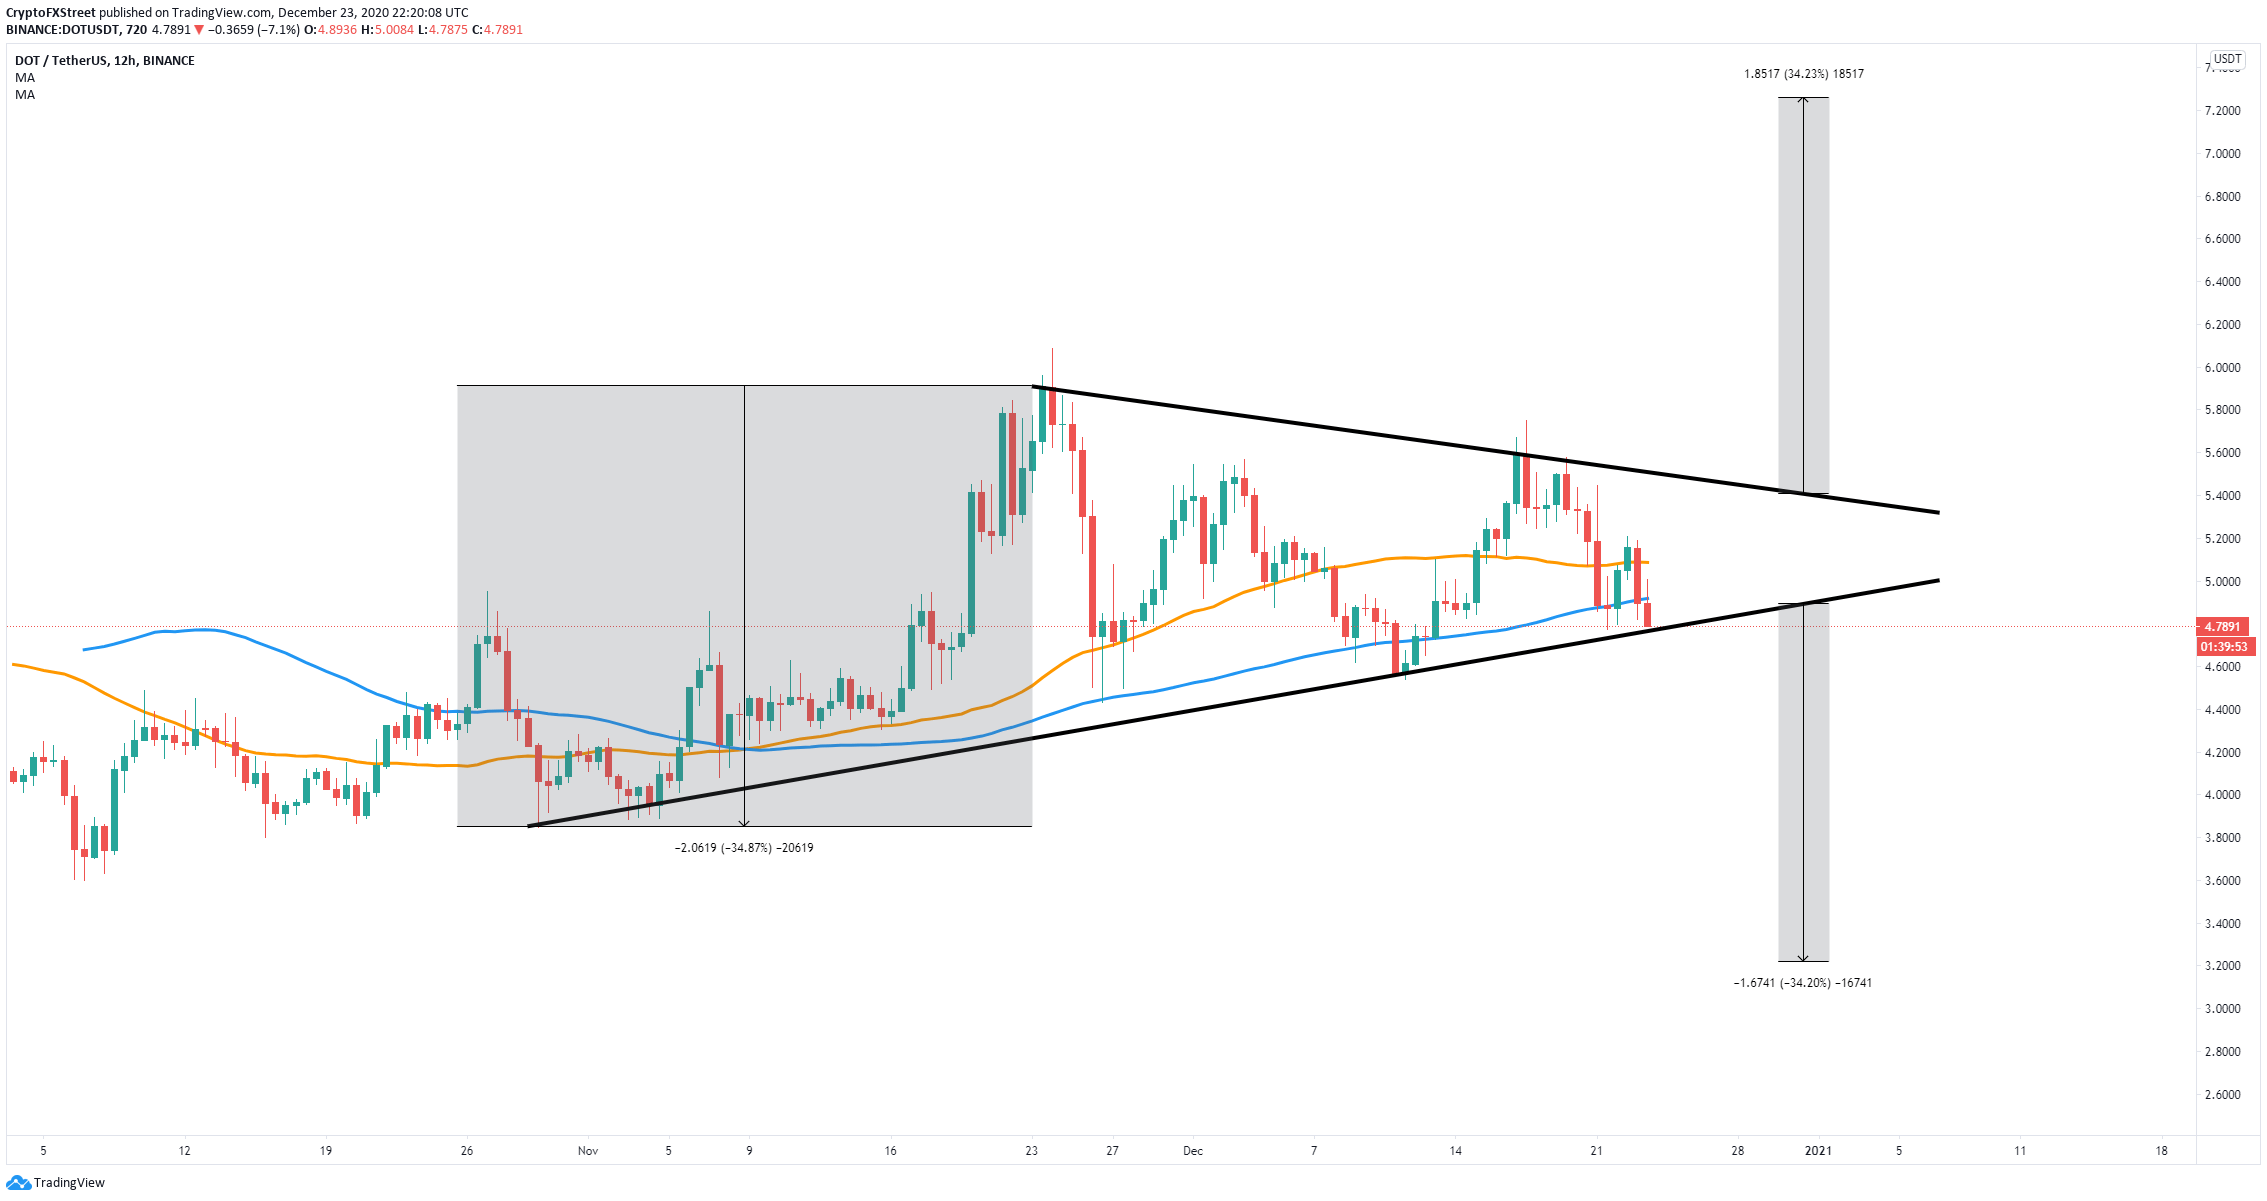
  • Polkadot price is contained inside a symmetrical triangle pattern on the 12-hour chart.
  • Bulls must defend a critical support level at $4.8 to avoid a colossal 34% drop.

Polkadot is currently trading at $4.81 just above a crucial support level. The digital asset has been under consolidation since November 23. The entire cryptocurrency market turned bearish in the past 24 hours, with XRP leading the way, dropping below $0.22. 

Polkadot price awaits a clear breakdown or breakout

DOT is trading just above the critical support level at $4.8 which is the lower trendline of the symmetrical triangle pattern. Bulls must defend this level and climb above the 100-SMA at $4.9 to recover some strength. 
dot price

DOT/USD 12-hour chart

If bulls can push Polkadot price above the 100-SMA and the 50-SMA, it will quickly jump towards the upper boundary of the pattern at $5.4. A breakout above this point can easily drive DOT towards a high of $7.3.

On the other hand, if bears continue in control of the trend and push Polkadot below $4.8, they will aim for a price target of $3.2 in the long-term, obtained by using the height of the pattern as a reference point.

Author

Lorenzo Stroe

Lorenzo Stroe

Independent Analyst

Lorenzo is an experienced Technical Analyst and Content Writer who has been working in the cryptocurrency industry since 2012. He also has a passion for trading.


More from Lorenzo Stroe
Share:

Editor's Picks

XRP holds bearish bias despite spot ETF inflows
Ripple (XRP) retains a bearish near-term tone on Friday, falling toward the psychological support at $1.00. This follows renewed inflation concerns in the United States (US) after the Federal Reserve (Fed) left interest rates unchanged, as two members of the committee dissented in favor of a 25 basis point hike.
Crypto Today: Bitcoin, Ethereum, XRP edge lower despite renewed ETF inflows
The cryptocurrency market broadly corrects on Friday, as investors assess macro uncertainty and geopolitical tensions, which continue to escalate in the Middle East. Bitcoin (BTC) is trading below $64,000, down from the weekly high of $65,745. Altcoins such as Ethereum (ETH) and Ripple (XRP) are trading under increasing selling pressure below $1,900 and $1.10, respectively.
US sanctions Iran-linked Bitcoin insurance scheme for Strait of Hormuz ships
The U.S. Treasury has sanctioned two Iranian firms behind a maritime insurance operation that accepted Bitcoin, saying the scheme forced commercial vessels to buy coverage to pass through the Strait of Hormuz and funnelled the proceeds to the Islamic Revolutionary Guard Corps.
Bitcoin Weekly Forecast: Bulls hold the line
Bitcoin (BTC) edges slightly lower, trading at $64,300 at the time of writing on Friday but holding firmly above a key support zone. US-listed spot Bitcoin Exchange Traded Funds (ETFs) support BTC as they continued to attract institutional flows through Thursday, pointing to the fourth consecutive week of net inflows.
Bitcoin: Bulls hold the line
Bitcoin (BTC) edges slightly lower, trading at $64,300 at the time of writing on Friday but holding firmly above a key support zone. US-listed spot Bitcoin Exchange Traded Funds (ETFs) support BTC as they continued to attract institutional flows through Thursday, pointing to the fourth consecutive week of net inflows.


