Over $530 million in crypto positions forcibly closed as Bitcoin price dips on Friday
- Bitcoin price dipped nearly 5% to an intraday low of $65,600 on Friday.
- Over $530 million in total liquidations witnessed as margin accounts stretched beyond their limits.
- Caution is key amid elevated volatility levels with expectations of low trading volumes characteristic of weekends.

The cryptocurrency market was in the red on Friday with almost all tokens shedding. The only outlier was Solana (SOL), with a nearly 10% gain, while Avalanche (AVAX) price was barely above water. The move, instigated by BTC, caught many off guard, with exchanges and brokerage platforms being compelled to close positions.
Also Read: Bitcoin price extends retreat from recent record high toward $68K support
Bitcoin price drop causes $533 million in total liquidations
Bitcoin (BTC) price dropped around 5% on Friday during the early hours of the New York session, recording an intraday low of $65,600.
The drop blew $134 million longs out of the water, while at the same time liquidating $46 million in short positions. The total BTC liquidations were above $180 million as of 18:00 GMT.
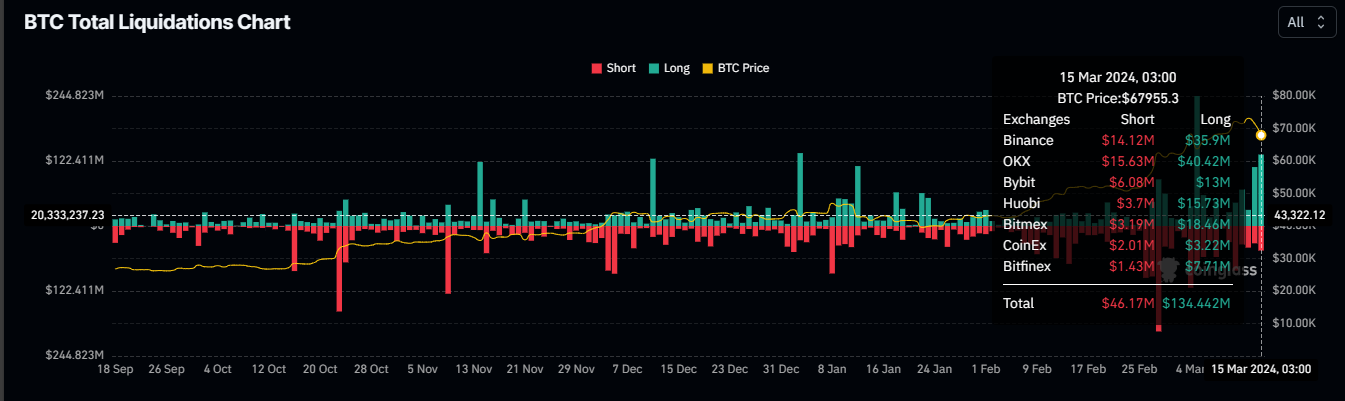
BTC liquidations
Further, the slump in Bitcoin price provoked a broader market crash with most altcoins shedding levels. Total crypto liquidations went above $533 million, comprising $416 million in long positions and $117 million in short positions.
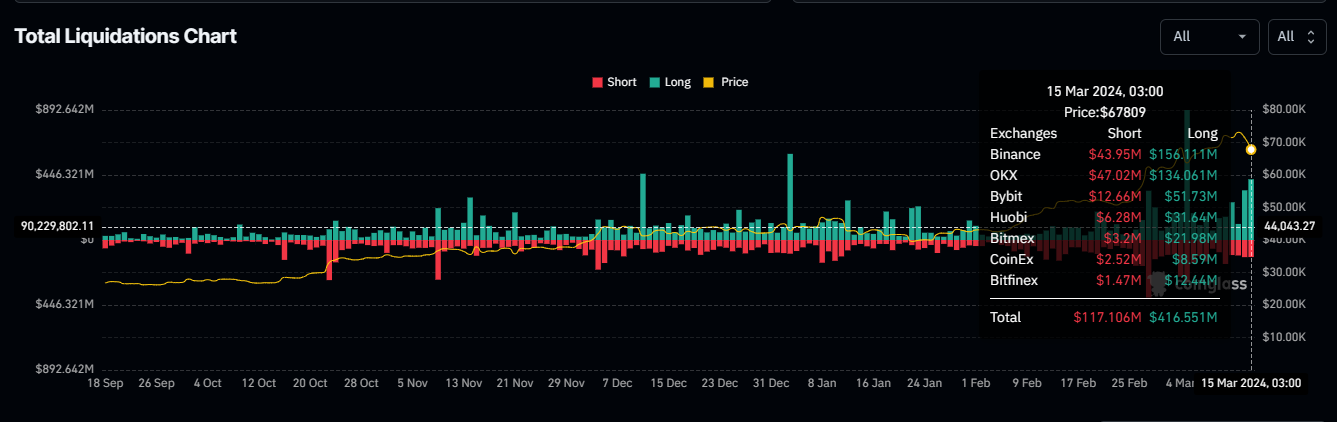
Total liquidations
Liquidation is when an exchange or brokerage platform forcibly closes the open order(s) of a trader in the cryptocurrency market. This happens when a trader's margin account is no longer able to support their open positions following a significant loss or a lack of sufficient margin to meet the maintenance requirements.
The position is closed at the market price to cover losses and outstanding debts, and with it, both the trader and exchange are protected from further losses. For the trader, their debt does not increase, while for the exchange, it is able to recover owed funds.
Along with the liquidations, BTC open interest has increased by $81 billion in 24 hours, moving from $36.44 billion to $37.25 billion. Open interest signifies the sum of all open long and short positions. It means market participants are entering new positions or increasing the size of their existing positions for BTC.
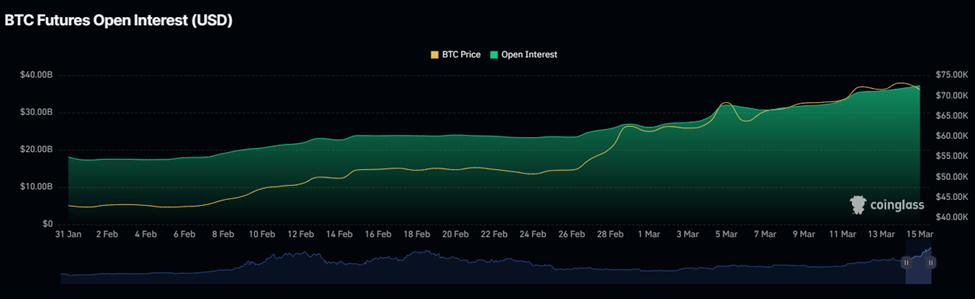
BTC Open Interest
With rising open interest, liquidity in the market is increasing with more active contracts now available for trading. This enhances price discovery while at the same time reducing bid-ask spreads.
Volatility is also expected to increase amid heightened market activity. This could force price action to diverge from market sentiment.
Effective risk management is key. Traders are encouraged to monitor their margin levels to avoid liquidation. This is even worse when the volatility levels in the market are high.
Open Interest, funding rate FAQs
Higher Open Interest is associated with higher liquidity and new capital inflow to the market. This is considered the equivalent of increase in efficiency and the ongoing trend continues. When Open Interest decreases, it is considered a sign of liquidation in the market, investors are leaving and the overall demand for an asset is on a decline, fueling a bearish sentiment among investors.
Funding fees bridge the difference between spot prices and prices of futures contracts of an asset by increasing liquidation risks faced by traders. A consistently high and positive funding rate implies there is a bullish sentiment among market participants and there is an expectation of a price hike. A consistently negative funding rate for an asset implies a bearish sentiment, indicating that traders expect the cryptocurrency’s price to fall and a bearish trend reversal is likely to occur.
Author

Lockridge Okoth
FXStreet
Lockridge is a believer in the transformative power of crypto and the blockchain industry.


