|

One key level separates Algorand price from a massive 26% jump

  • Algorand price is contained inside an ascending triangle pattern on the 4-hour chart.
  • The digital asset is up by 15% in the past 24 hours and bulls aim for more.
  • ALGO needs to climb above a crucial resistance level to see a significant breakout.

Algorand has been trading sideways inside a tightening pattern and seems ready for a massive breakout if bulls can push the digital asset above a key resistance level. The entire cryptocurrency market has recovered significantly, favoring the bulls.

Algorand price is on the brink of a 26% breakout towards $1.5

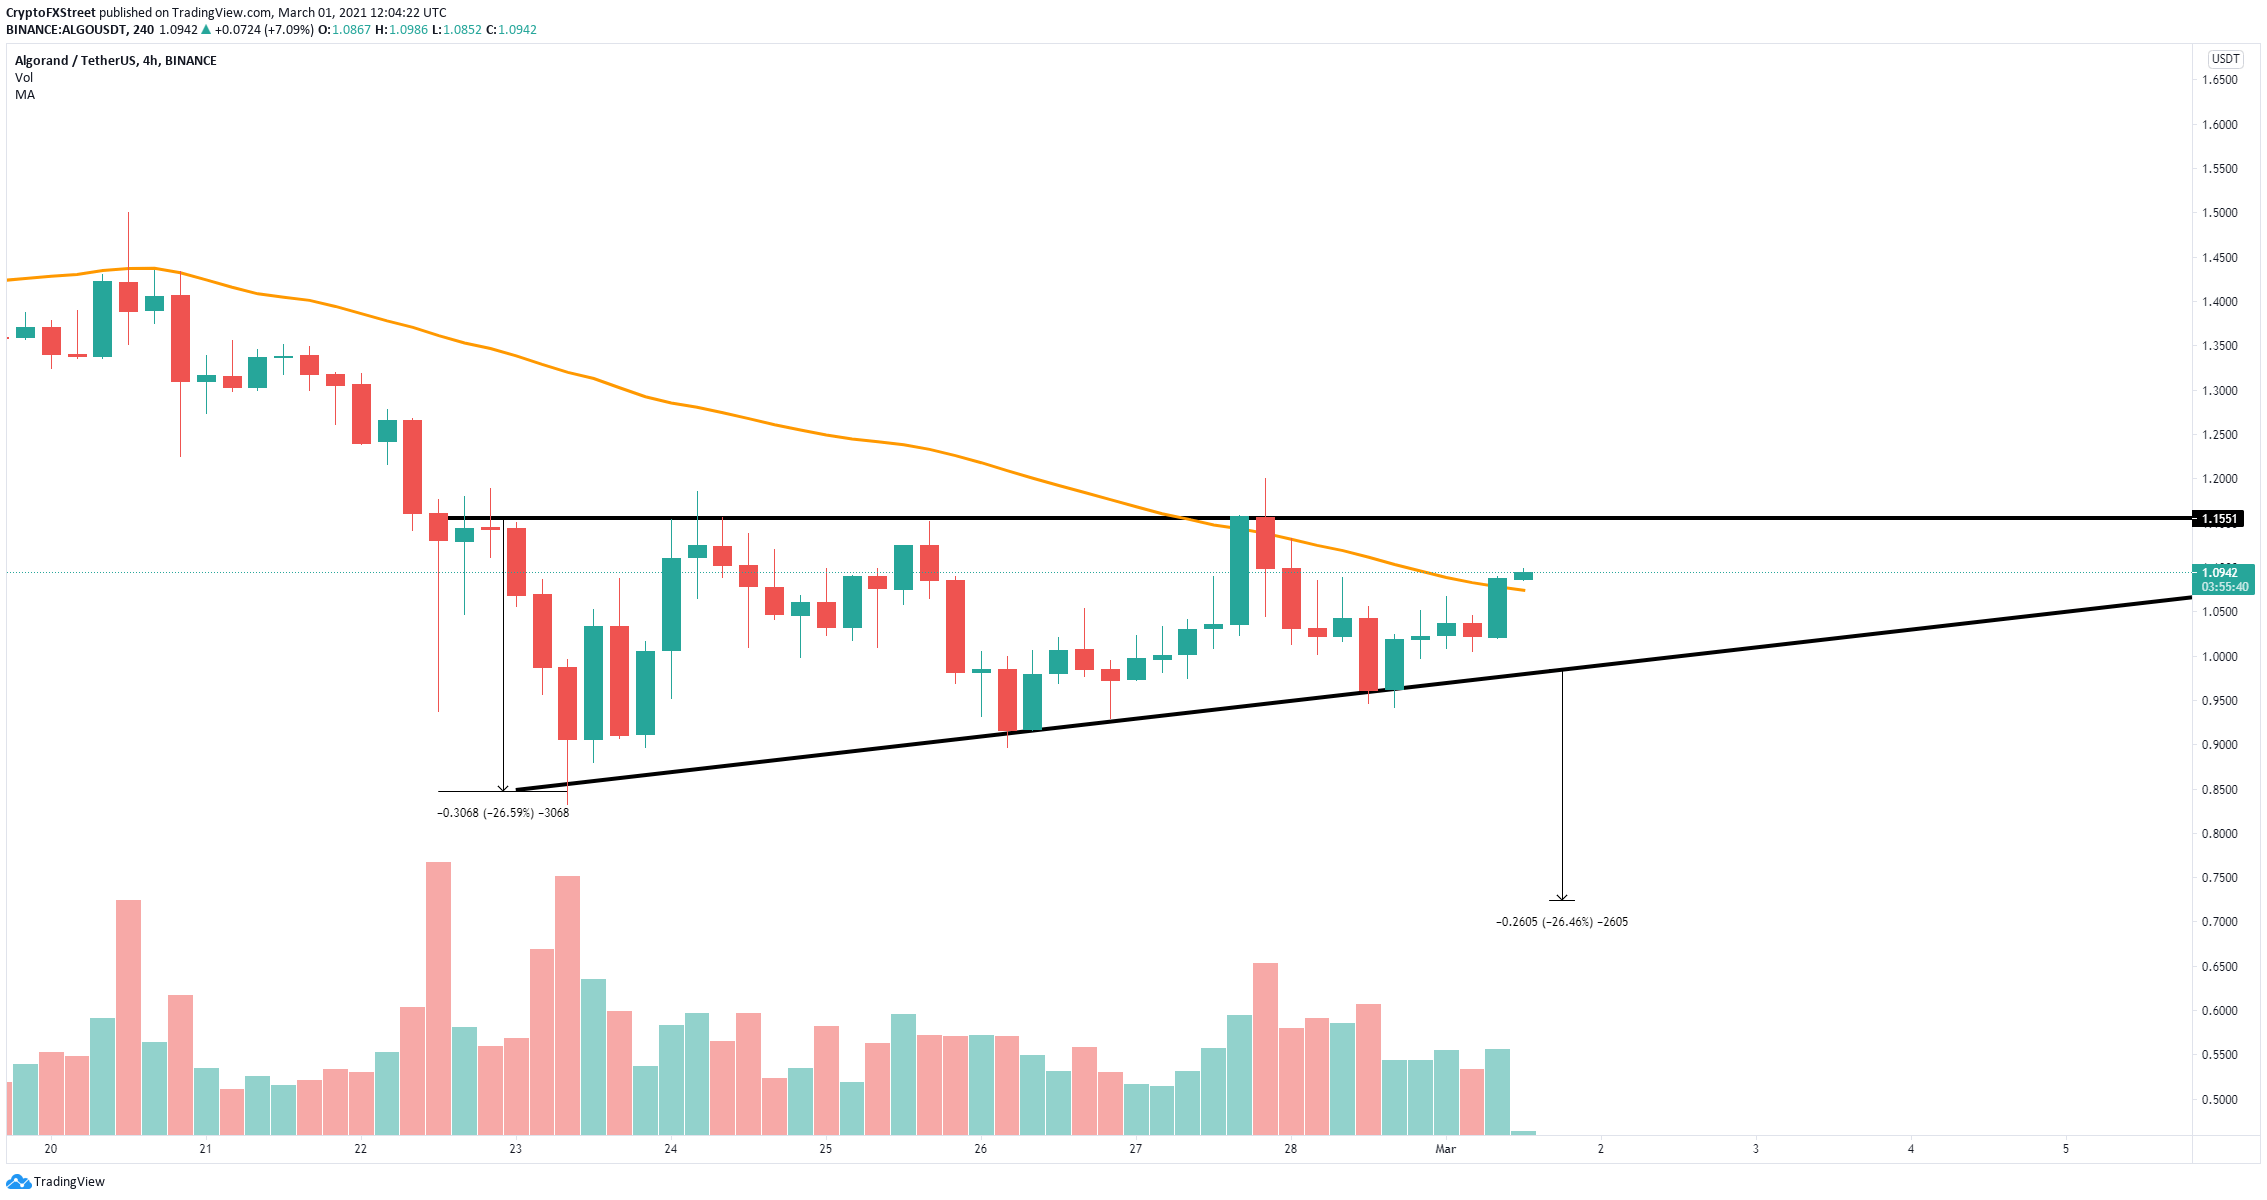
On the 4-hour chart, Algorand has established an ascending triangle pattern that seems to favor the bulls amid the recent cryptocurrency market recovery. Bulls need to push ALGO above the 50-SMA level first.

algo price

ALGO/USD 4-hour chart

The critical resistance trendline is located at $1.15. A breakout above this point will quickly drive Algorand price towards the 100-SMA at $1.25, and eventually up to the long-term price target of $1.5.

algo price

ALGO/USD 4-hour chart

On the other hand, failure to hold the price above the 50-SMA would lead Algorand towards the lower trendline at $1. A breakdown below this point has a price target of $0.72.

Author

Lorenzo Stroe

Lorenzo Stroe

Independent Analyst

Lorenzo is an experienced Technical Analyst and Content Writer who has been working in the cryptocurrency industry since 2012. He also has a passion for trading.

More from Lorenzo Stroe
Share:

Editor's Picks

Ripple bulls defend key support amid waning retail demand and ETF inflows

XRP ticks up above $1.40 support, but waning retail demand suggests caution. XRP attracts $4 million in spot ETF inflows on Thursday, signaling renewed institutional investor interest.

Crypto Today: Bitcoin, Ethereum, XRP rebound as risk appetite improves

Bitcoin rises marginally, nearing the immediate resistance of $68,000 at the time of writing on Friday. Major altcoins, including Ethereum and Ripple, hold key support levels as bulls aim to maintain marginal intraday gains.

Bitcoin Weekly Forecast: No recovery in sight 

Bitcoin price continues to trade sideways between $65,729 and $71,746, extending its consolidation since February 7. US-spot ETFs record an outflow of $403.90 million through Thursday, pointing to the fifth consecutive week of withdrawals.

Pi Network Price Forecast: PI recovery stalls amid profit-taking

Pi Network tests 50-day EMA support on Friday, after a 5% decline the previous day. PiScan data shows large deposits on CEXs totaling over 4 million PI tokens in the last 24 hours, reflecting an exodus of investors taking profits.

Bitcoin Price Annual Forecast: BTC holds long-term bullish structure heading into 2026

Bitcoin (BTC) is wrapping up 2025 as one of its most eventful years, defined by unprecedented institutional participation, major regulatory developments, and extreme price volatility.

Bitcoin: No recovery in sight

Bitcoin (BTC) price continues to trade within a range-bound zone, hovering around $67,000 at the time of writing on Friday, and falling slightly so far this week, with no signs of recovery.