OMG Network price awaits a clear breakout towards $6.2 as market’s volatility increases
- OMG Network price remains relatively stable in comparison to Bitcoin and the market.
- The digital asset is bounded inside a tightening range and awaits a clear breakout or breakdown.

Considering that Bitcoin has just established a new all-time high above $23,000 it’s surprising to see OMG Network not reacting at all. The digital asset continues trading inside a parallel channel on the daily chart right in the middle of the pattern.
OMG Network price is inside a no-trade zone
OMG Network has established a parallel channel on the daily chart and has been trading sideways since September 15. The Bollinger Bands are squeezing again after an attempt to breakout on November 25.
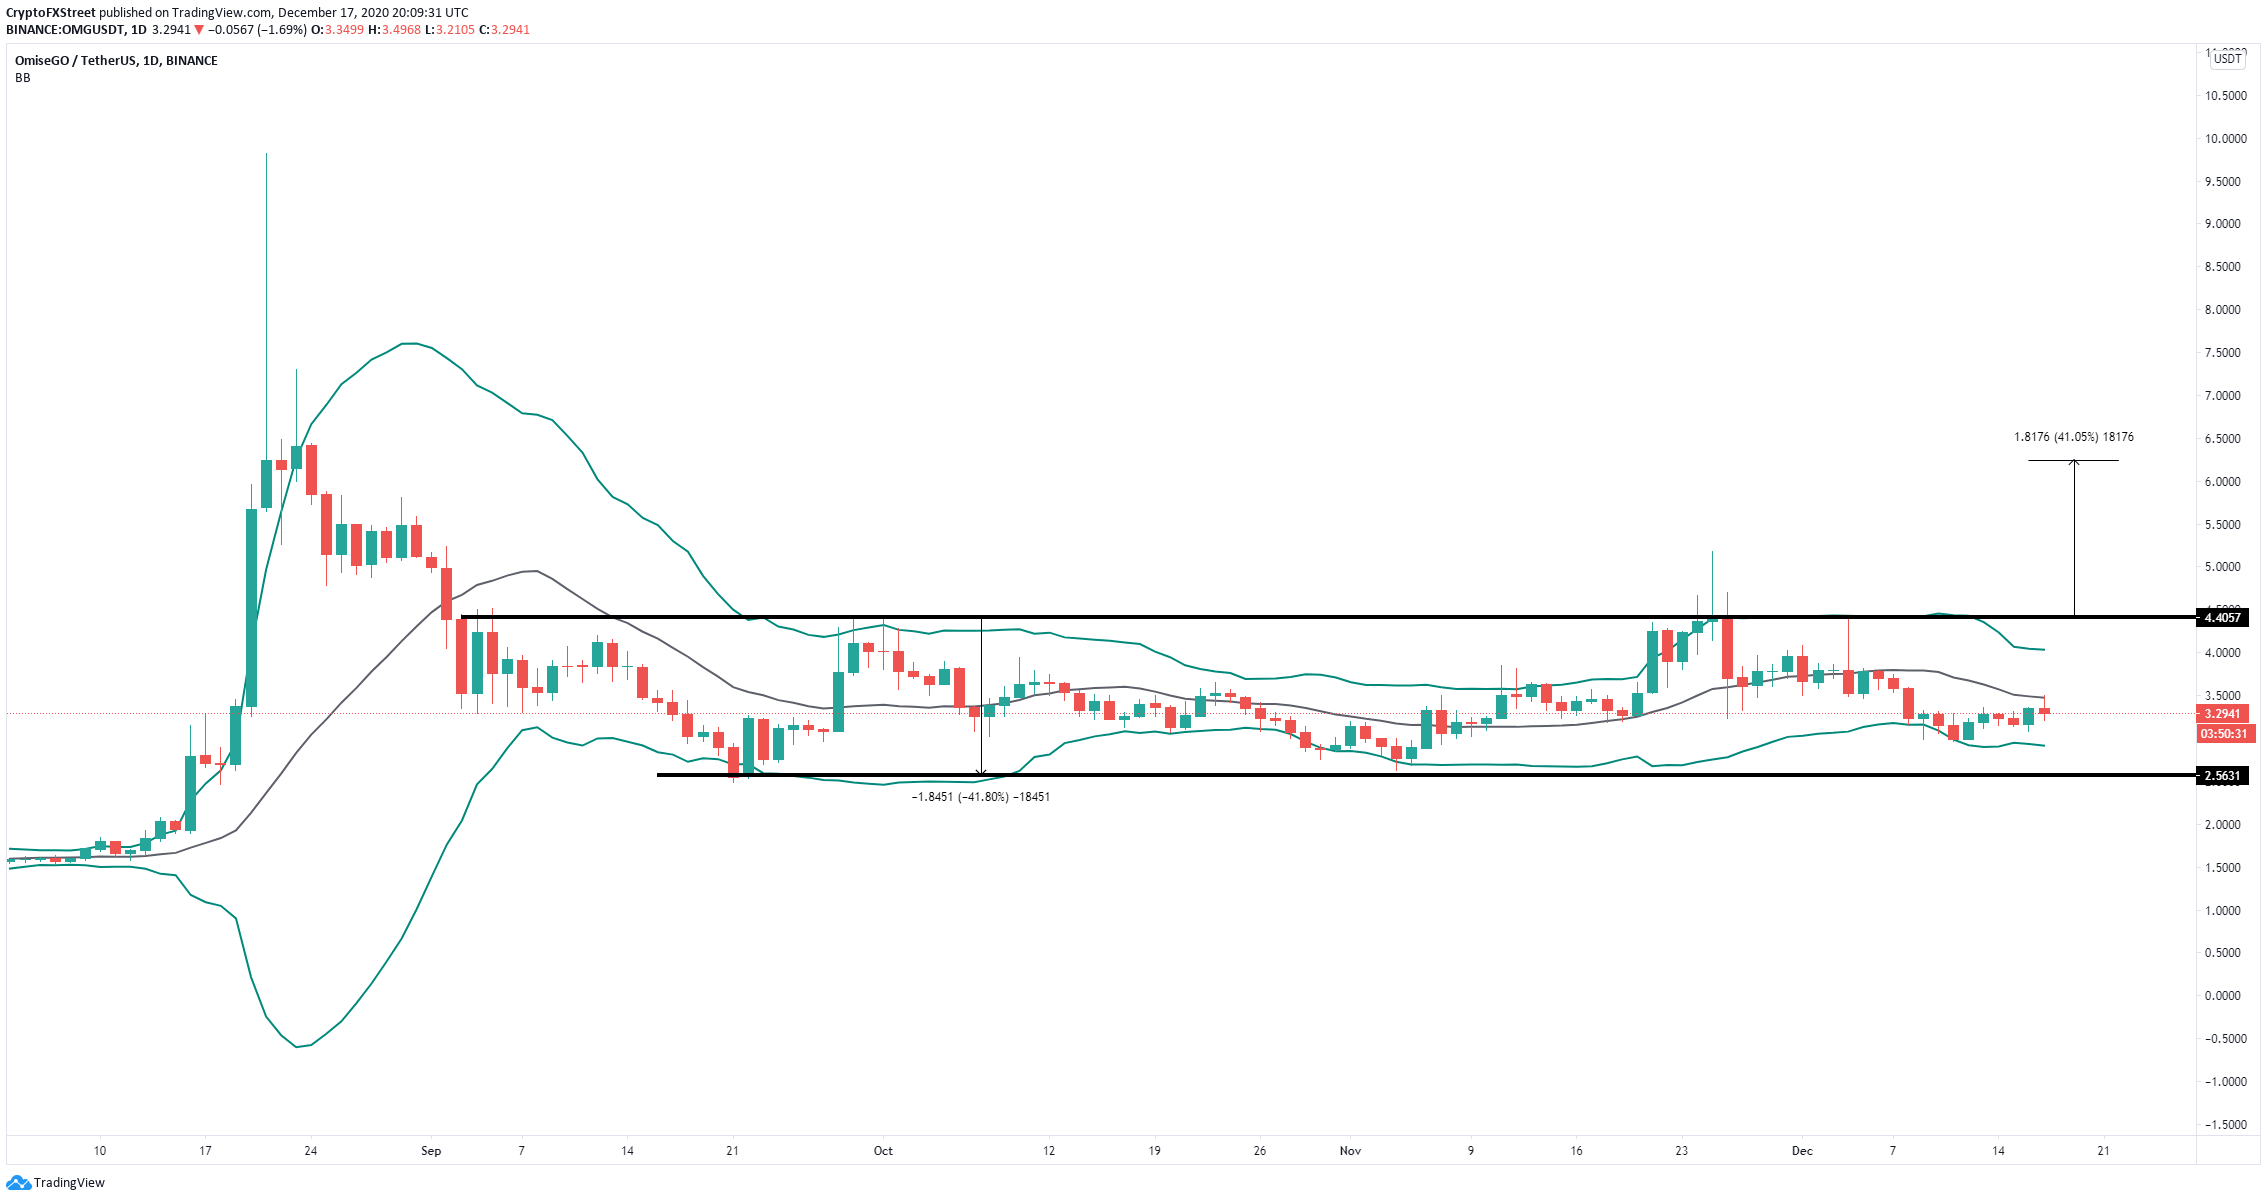
OMG/USD daily chart
Considering the recent Bitcoin price breakout above $20,000, it’s safe to say that bulls should have the upper hand. The next resistance level is the middle of the Bollinger Bands at $3.5. However, bulls need to crack the upper trendline resistance at $4.4 to see a move towards $6.2.
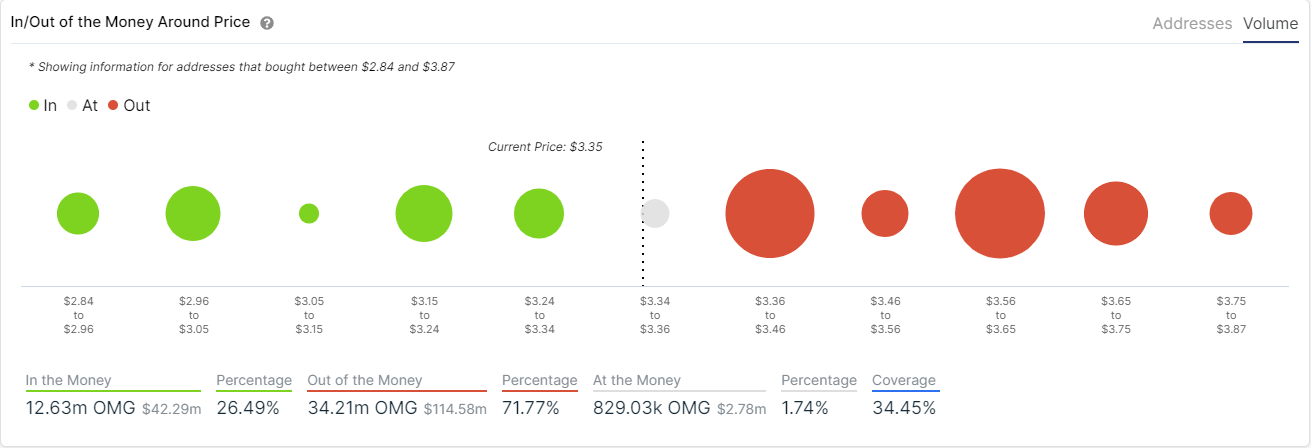
OMG IOMAP chart
However, the In/Out of the Money Around Price (IOMAP) chart shows steep resistance ahead between $3.36 and $3.46 and another notable resistance area located between $3.56 and $3.65. On the way down, the support seems to be far weaker in comparison. A breakdown below $3.27 can quickly push OMG Network price towards the lower trendline of the parallel channel at $2.56.
Author

Lorenzo Stroe
Independent Analyst
Lorenzo is an experienced Technical Analyst and Content Writer who has been working in the cryptocurrency industry since 2012. He also has a passion for trading.


