NEO price analysis: NEO breaks below SMA200 daily; more pain ahead
- NEO/USD drops below critical support created by SMA200 daily.
- The coin may extend the downside to $9.00.

NEO reached the recent top at $11.75 on November 4 and resumed the decline. The coin had been drifting lower inside the range; however, an increased bearish pressure pushed the price below $11.00 on Thursday and worsened the short-term technical picture.
NEO is the 18th largest digital asset with the current market value of 766 million and an average daily trading volume of $440 million. The coin has lost nearly 4% in recent 24 hours and decreased by 2% since the beginning of the day. At the time of writing, NEO/USD is changing hands at $10.87.
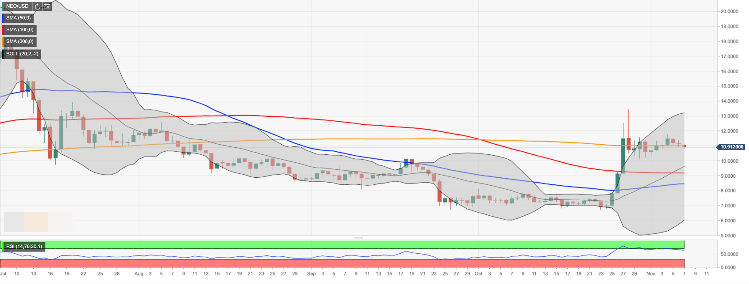
NEO/USD, the technical picture
From the longer-term perspective, a sustainable move below SMA200 (Simple Moving Average) daily bodes ill for NEO bulls. At the time of writing, this MA coincides with psychological $11.00, thus we will need to see a recovery above this handle to mitigate the initial bearish pressure. Once it is out of the way, the upside is likely to gain traction with the next focus on $11.75 (this week's high) followed by $12.00.
On the downside, the initial support is created by $10.00-$10.30 area that has been limiting the decline since the end of October. Once it is out of the way, the sell-off is likely to gain traction with the next focus on $9.60 ( the middle line of the daily Bollinger Band) and $9.20 (SMA100 daily).
NEO/USD, thee daily chart
Author

Tanya Abrosimova
Independent Analyst


