Nearly 60% of ARB holders are underwater despite 50% rally in Arbitrum price, why?
- Arbitrum price edges closer to achieving the W-bottom pattern’s target of $1.187.
- Sustained bullish momentum could send ARB to tag a key resistance level of $1.330.
- A closer look at on-chain metrics reveals a potential reversal might be in store for ARB.
Arbitrum (ARB) price has shot up 50% since mid-October 2023 and shows signs of exhaustion. While an extension of the upswing is likely, a minor pullback could be around the corner. Despite the impressive rally witnessed over the last three weeks, most ARB holders sit underwater. To be specific, nearly 60% of all ARB investors are out of the money, according to data from IntoTheBlock.
Roughly 2.5 billion ARB tokens held by nearly 170,000 addresses are sitting underwater. These tokens were purchased at an average price of $1.400, roughly 27% away from where ARB currently trades.

ARB GIOM
Arbitrum price flashes sell signals
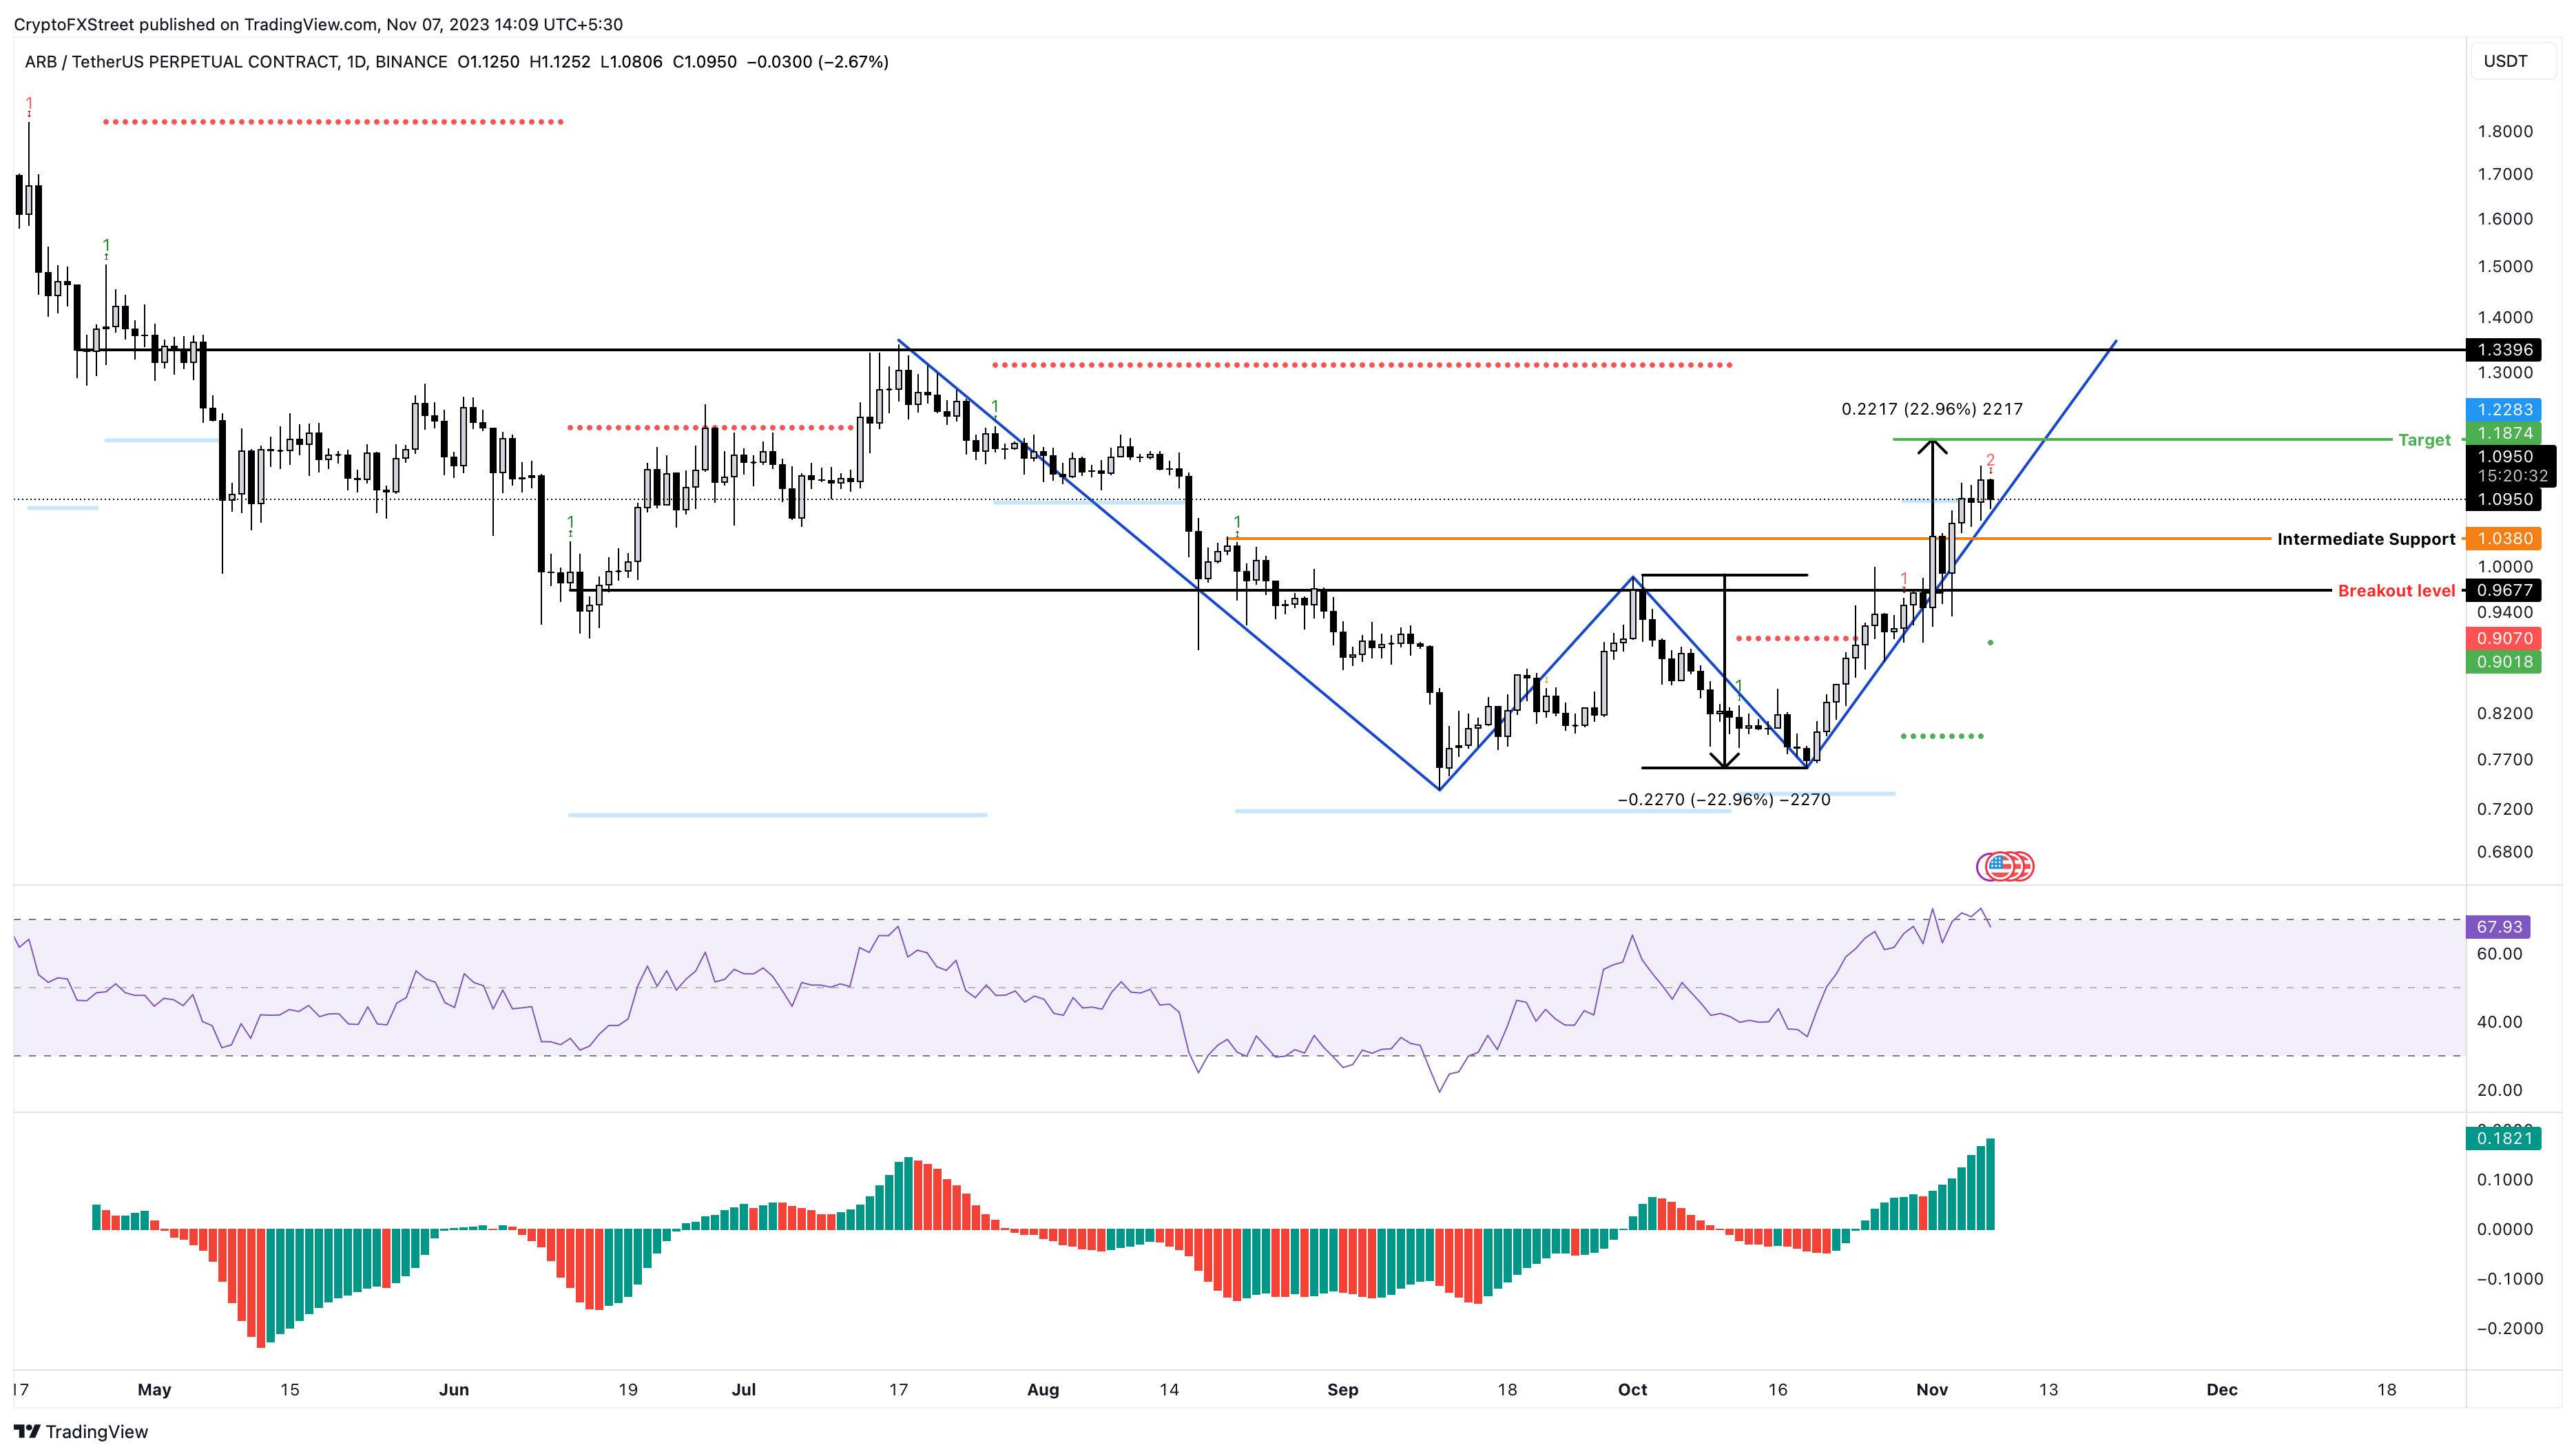
Arbitrum (ARB) price is close to approaching the W-pattern or double bottom setup’s target of $1.187. As the name indicates, this technical formation looks like the letter W and is formed after a downtrend. It serves as a base that kick starts a trend reversal.
Since this pattern is formed after a downtrend, a horizontal trend line connecting the peak of swing high formed between the two swing lows results in a neckline. For Arbitrum price, this neckline is formed at $0.967. When the neckline is broken the expectation is for price to reach the bullish target for the pattern. This is calculated by taking the distance from the base to the neckline and doubling it. In the case of ARB this gives a target at $1.187, which is 22% higher.
So far, Arbitrum price has rallied 20% to $1.098 and currently sits just below the target. But the Momentum Reversal Indicator (MRI) has flashed a red “two” sell signal on the daily chart, which forecasts one-to-four down candlesticks.
While the theoretical forecast from the double bottom pattern is close, it is unlikely to be tagged. Investors can expect Arbitrum price to see a minor pullback to a key support level at $1.038.
The Relative Strength Index (RSI) and the Awesome Oscillator (AO) are both showing no signs of exhaustion yet. But the RSI sits in the overbought condition, and Bitcoin price also looks to be moving sideways. Hence, a surprise spike in selling pressure could kickstart this quick pullback to $1.038 followed by a revisit of the $1.000 psychological level.
ARB/USDT 1-day chart
On-chain metrics reveal long-term holders’ intentions
While the technical outlook for Arbitrum price calls for an extension of the rally after a minor pullback, on-chain metrics show a clearer picture.
The Mean Dollar Invested Age (MDIA) indicator from Santiment can be used to detect investor sentiment. This index shows that short-term holders, aka 90-day MDIA, are accumulating while long-term holders, aka 365-day MDIA, are shedding their holdings.
If the long-term MDIA is falling as is the case with ARB, it suggests redistribution and can be viewed as a sell signal.
Although Arbitrum price has rallied 50% in the last three weeks, long-term holders are not confident about the sustainability of this upswing and could be booking profits.
 [13.55.26, 07 Nov, 2023]-638349447771485343.png)
ARB MDIA
The Network Growth (NG) indicator is a metric used to track the number of new addresses created on the blockchain. It is a gauge of adoption. For Arbitrum, the NG grew from 2,133 on October 21 to 10,555 on November 4.
This quadrupling of the new addresses created on the Arbitrum blockchain spike coincides with the ARB rally. But at present, the NG is hovering around 679, which is lower than when it first started out.
Hence, the technical perspective’s sell signal coincides perfectly with the NG’s local top and suggests the possibility of a trend reversal.
Additionally, the on-chain volume for ARB has also dropped from 470 million ARB on November 4 to 385 million ARB on November 7, suggesting a lack of interest among investors.
A closer look reveals that the on-chain volume has formed three lower lows while Arbitrum price has set up three higher highs, revealing a non-conformity termed “bearish divergence.” This formation also forecasts a potential correction.
 [13.55.30, 07 Nov, 2023]-638349447971332420.png)
ARB NG, On-chain Volume
Author

Akash Girimath
FXStreet
Akash Girimath is a Mechanical Engineer interested in the chaos of the financial markets. Trying to make sense of this convoluted yet fascinating space, he switched his engineering job to become a crypto reporter and analyst.


