Mina Protocol price hints at 23% recovery rally after bullish swing failure pattern
- Mina Protocol price has swept the December 28, 2023 lows and shows signs of recovery.
- If a few more conditions are met, MINA holders can expect a 23% rally to $1.36.
- A flip of the range low at $1.02 into a resistance level will invalidate the bullish thesis.

Mina Protocol (MINA) price is at a pivotal point and could kickstart a double-digit recovery rally. Investors need to wait for a few key developments to get a high probability long setup.
Also read: PEOPLE price set to undo 80% gains, hints at double-digit correction
MINA price speculates trend reversal
Mina Protocol (MINA) price shed nearly 40% between January 2 and 6, creating a range that extends from $1.02 to $1.69. The move that created the aforementioned range low swept the December 28 low and recovered quickly, producing a bullish swing failure pattern.
This setup is often formed after sweeping below key swing points and is the first sign that the trend reversal is near.
Now, investors need to wait for MINA price to produce a higher low and a higher high, which would be the second sign of trend reversal. If the higher low dips into the one-hour demand zone, extending from $1.10 to $1.07, it would be a good place to enter long positions.
After this move, MINA price should see a considerable spike in buying pressure that propels it higher, confirming the start of an uptrend. The first target for bulls would be the $1.30 to $1.32 resistance barrier. Clearing this hurdle would open the path for a retest of the range’s midpoint at $1.36.
This move would constitute a 23% gain from the demand zone’s upper limit of $1.10 and is likely where investors can consider scaling out of their bullish position.
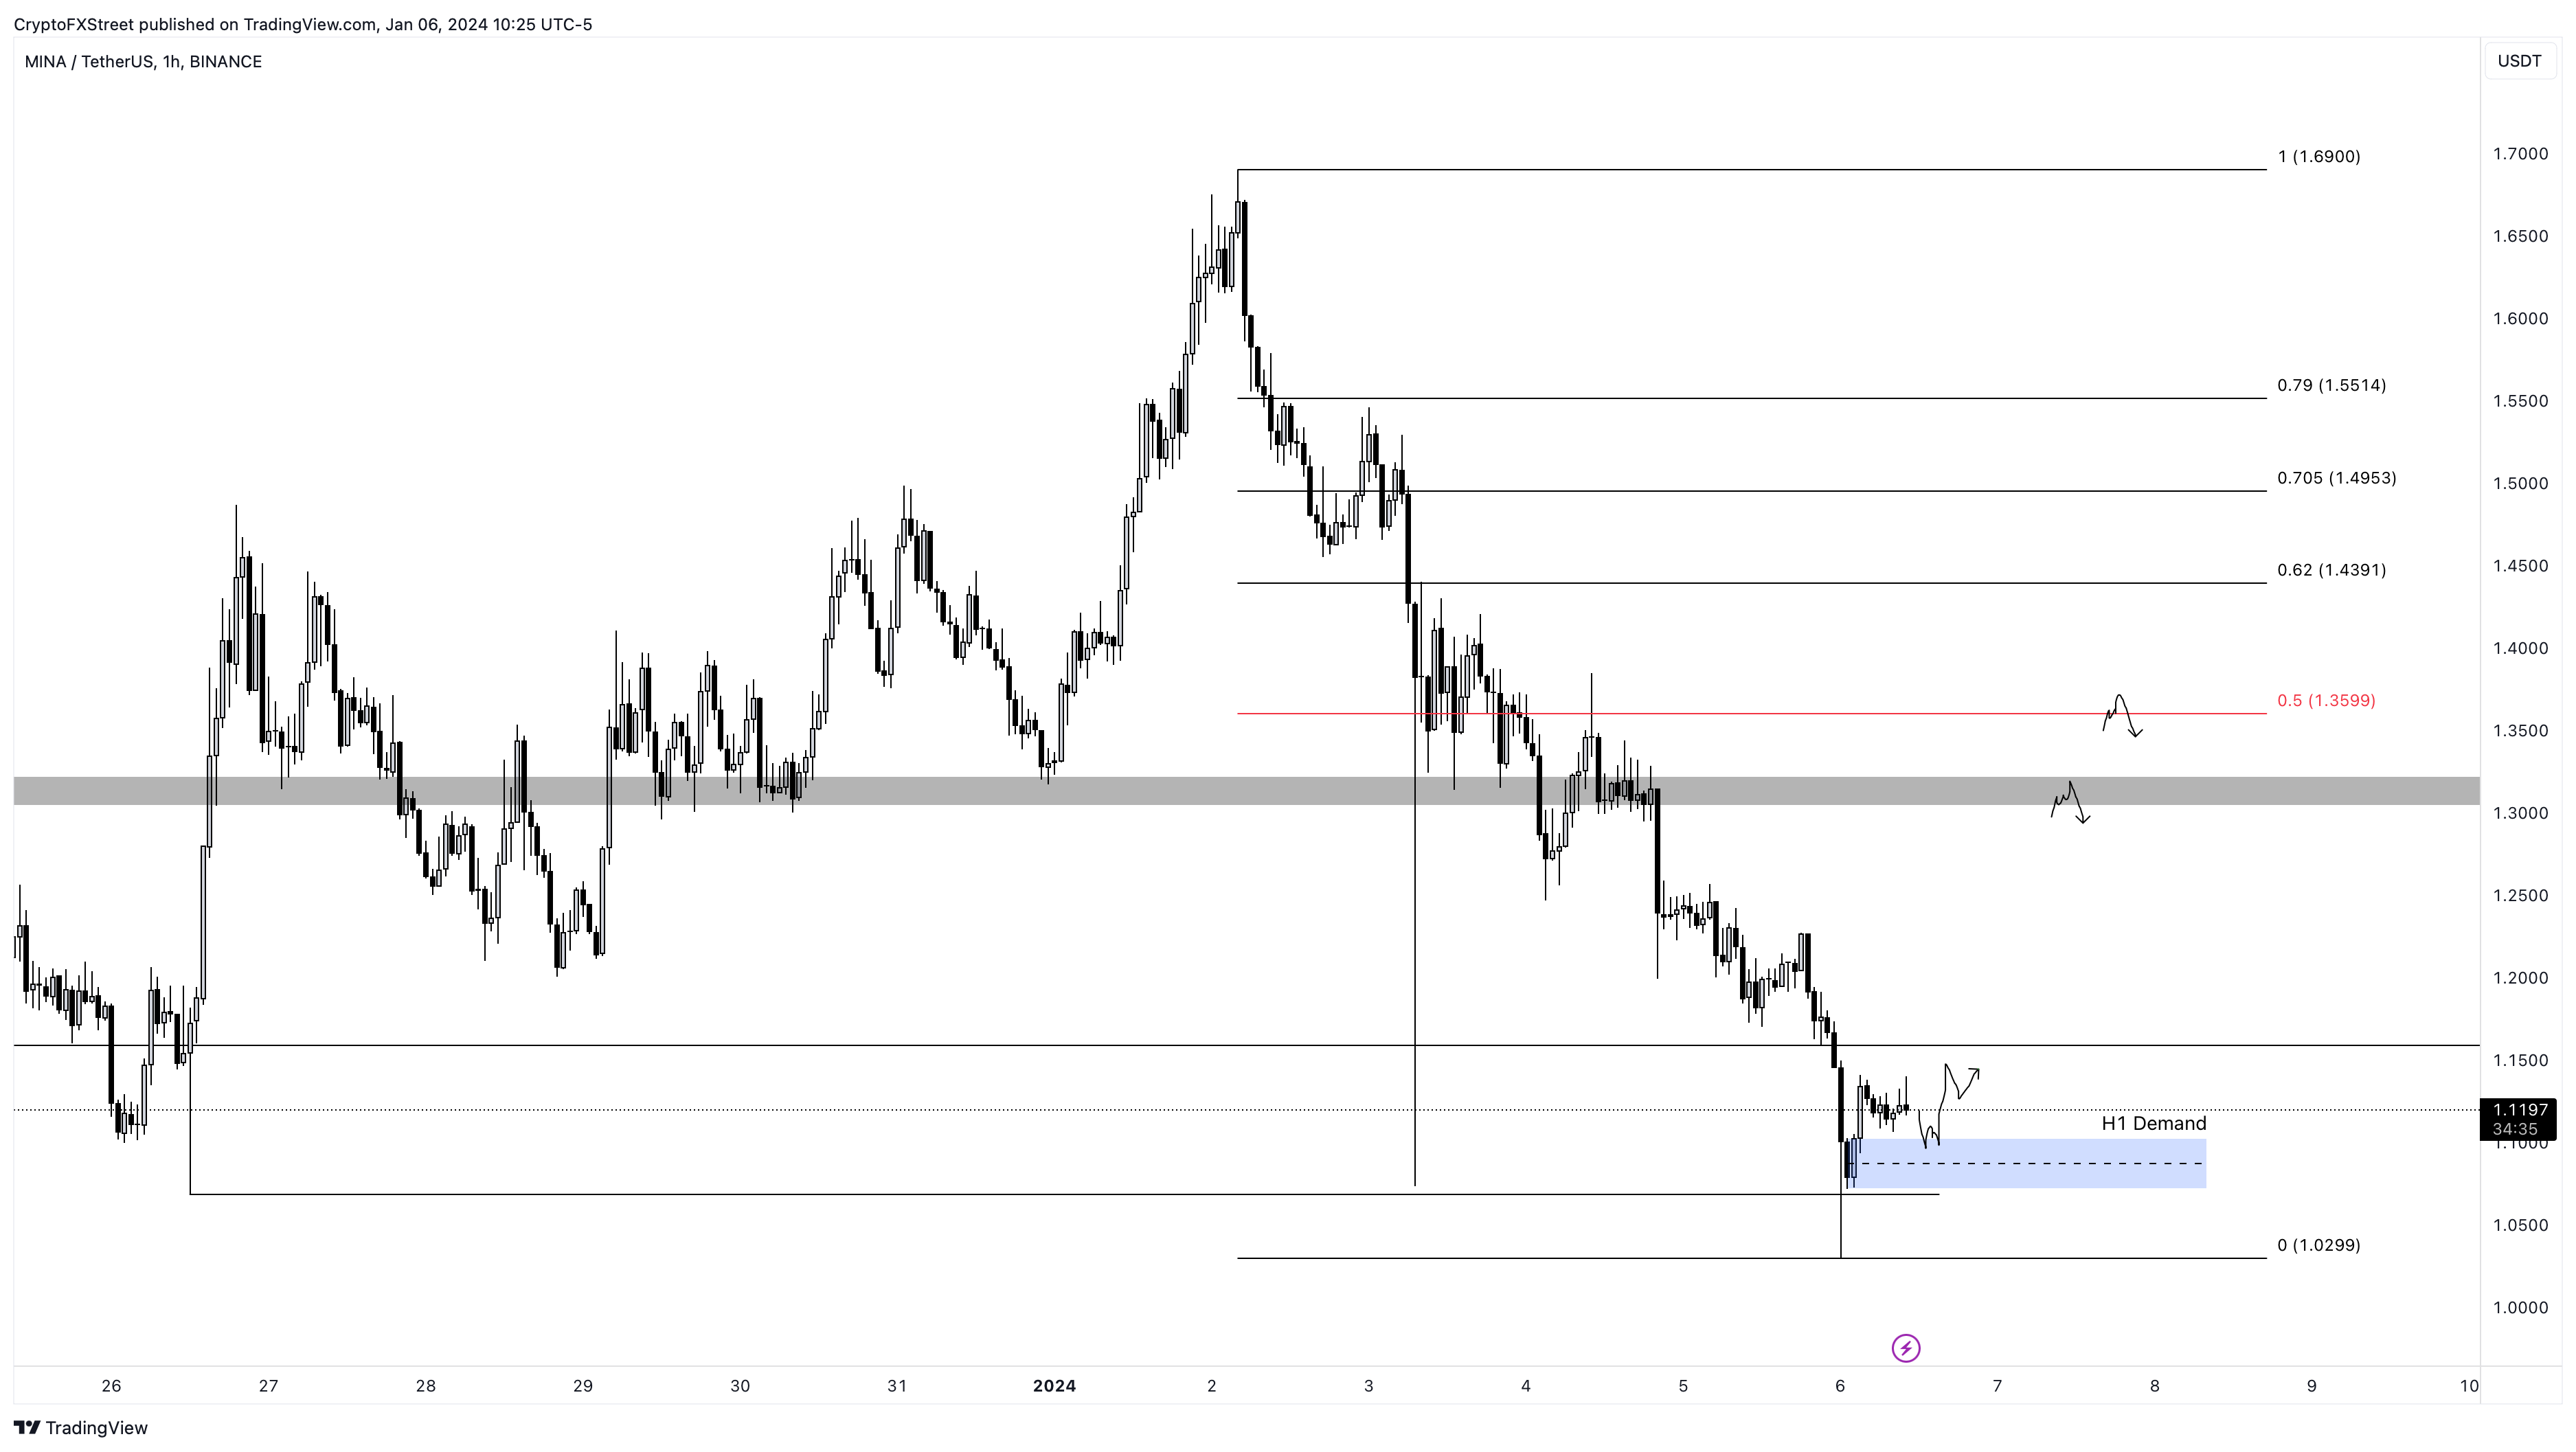
MINA/USDT 1-hour chart
Also read: XRP price falls to two-month lows despite Grayscale adding Ripple to its Digital Large Cap Fund
While the bullish outlook described above makes sense, there are a lot of contingencies and hence the chances of failure are high. If MINA price fails to produce a higher low and higher high, instead continues to succumb to the selling pressure, the bulls can get punished for premature entries.
In such a case, if MINA price flips the range low at $1.02 into a resistance level, it would create a lower low and invalidate the bullish thesis. Such a development could see MINA revisit the $1 psychological level, breaching which, could send it spiraling downwards by 8% to the next key support level at $0.94.
Read more: Bitcoin spot ETF approval could come as soon as Tuesday, new filings hint
Author

Akash Girimath
FXStreet
Akash Girimath is a Mechanical Engineer interested in the chaos of the financial markets. Trying to make sense of this convoluted yet fascinating space, he switched his engineering job to become a crypto reporter and analyst.


