MATIC Price Prediction: Polygon recovery in jeopardy while on-chain metrics flip bearish
- MATIC's least resistance path is downward within a descending parallel channel.
- Recovery could be uphill battle based on immense resistance in IOMAP model.
- Bulls may start regaining control if MACD crosses above the signal line on the 4-hour chart.

MATIC struggles with sustaining the uptrend after briefly diving from the 4-hour 50 Simple Moving Average (SMA) resistance. Its recovery is treading on a thin layer of ice due to deteriorating on-chain metrics. If support above $0.3 fails to hold, Polygon may plunge toward $0.2.
MATIC bulls fight to take control
Polygon is trading within the confines of a descending parallel channel. The rejection at the 50 SMA resulted in the dip under the channel's middle boundary support. A recovery ensued on testing the lower edge, reinforced by the 200 SMA.
At the time of writing, MATIC is exchanging hands at $0.33 amid the scuffle to nurture the uptrend. The Moving Average Convergence Divergence (MACD) indicator is sloping downward, thus making recovery an uphill task. Polygon will be vulnerable to losses if the middle boundary's pivotal level is lost as short-term support.
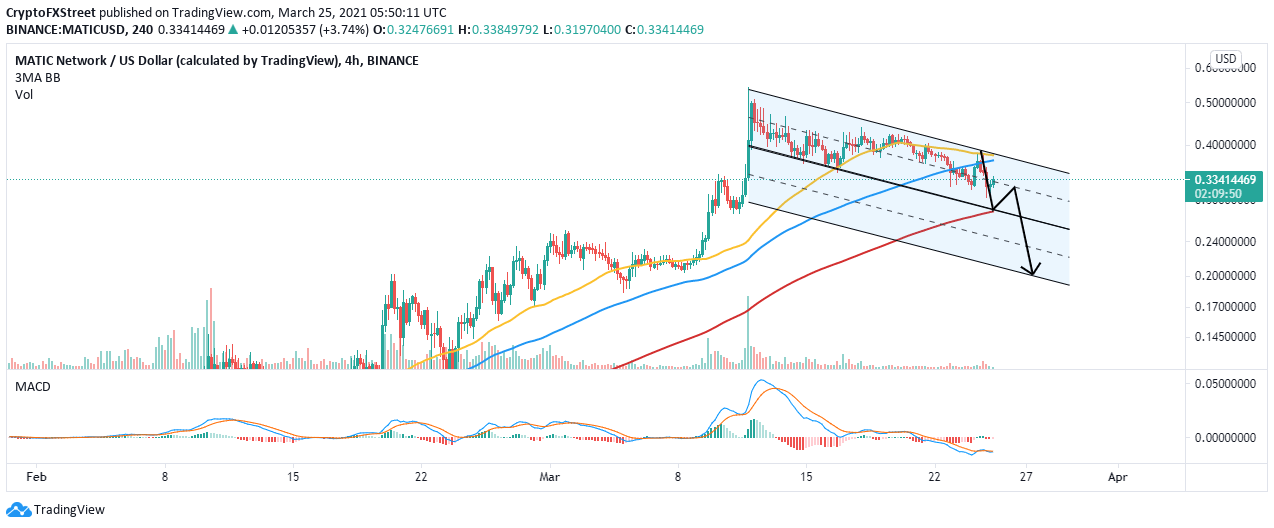
MATIC/USD 4-hour chart
The IOMAP, an on-chain metric by IntoTheBlock, reveals intense resistance ahead of Polygon. Currently, the most robust seller concentration zone runs from $0.335 to $0.345. Here, roughly 1,100 addresses had previously purchased approximately 74 million MATIC. Other hurdles have lined up the path heading to $0.4 and are likely to delay recovery.
On the downside, support is relatively weak. The model brings to light the subtle anchor zone at $0.306 and $0.316. Here, around 1,100 addresses had previously bundled up roughly 19.7 million MATIC. This shows that the least resistance path is downward.
-637522513867499580.png)
Looking at the other side of the picture
It is worth noting that establishing support above the descending channel's middle boundary would bring stability back to the market. Moreover, buyers watching from the sidelines are likely to return to the market to anticipate gains above $0.4. The uptrend will be validated by the MACD line (blue) crossing above the signal line.
Author

John Isige
FXStreet
John Isige is a seasoned cryptocurrency journalist and markets analyst committed to delivering high-quality, actionable insights tailored to traders, investors, and crypto enthusiasts. He enjoys deep dives into emerging Web3 tren


