MATIC Price Prediction: Polygon kickstarts 40% sell-off
- MATIC price could be starting a new downtrend after surging nearly 700% between February 8 and March 11.
- The recent correction has pushed Polygon through the ascending parallel channel’s lower trend line.
- The bearish outlook’s secondary confirmation will arrive after a decisive close below the 100 SMA at $0.30.

The MATIC price confirms one out of two confirmations that could invoke a steep correction.
MATIC price poised for a massive downswing
MATIC price has been on a constant upswing since February 8, which has resulted in an 8x return as of March 11. Since then, Polygon has lost steam, which has depreciated its market value by 36% at the time of writing.
The 7% price crash on March 22 has resulted in a breach of the ascending parallel channel. This setup forecasts a 40% drop determined by adding the channel’s height to the breakout point.
The resulting target puts the MATIC price at $0.20, which coincides with the 50% Fibonacci retracement level and the 200 Simple Moving Average (SMA) on the 6-hour chart.
The MATIC price has confirmed a bearish breakout since it already sliced through the ascending parallel channel’s lower boundary at $0.35.
The 100 six-hour SMA at $0.30 will serve as a secondary confirmation for Polygon’s descent.
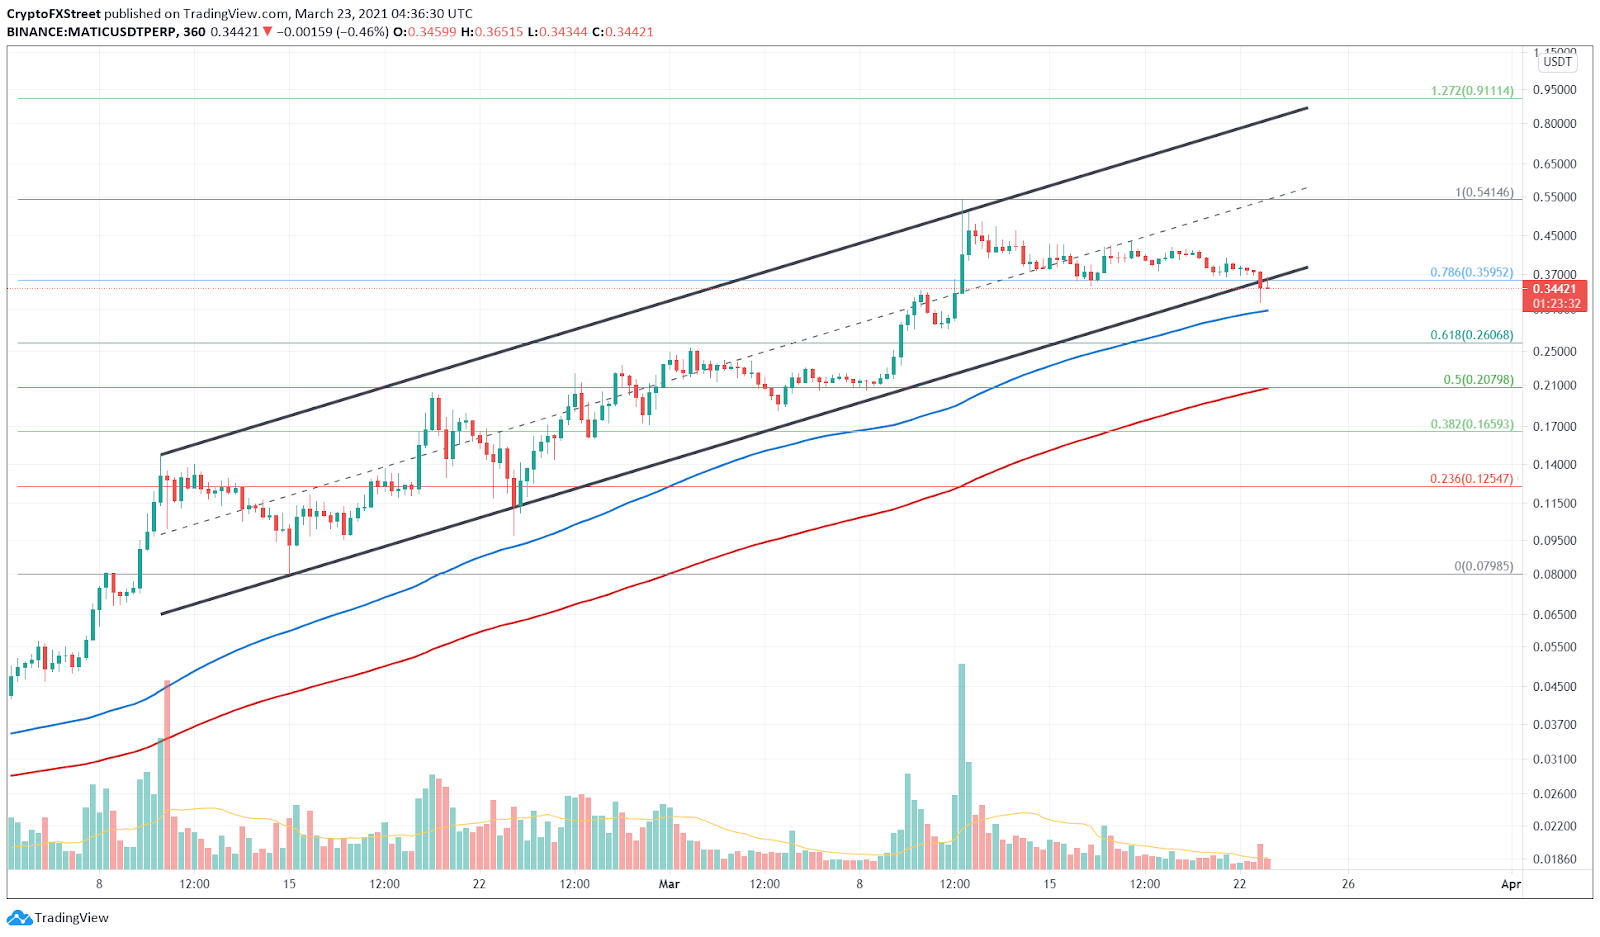
MATIC/USDT 6-hour chart
IntoTheBlock’s In/Out of the Money Around Price (IOMAP) model adds credence to this pessimistic outlook. This metric shows little to no demand barriers but the presence of stiff resistance levels.
Hence, any bearish pressure could easily topple the demand barriers and lead to a sell-off.
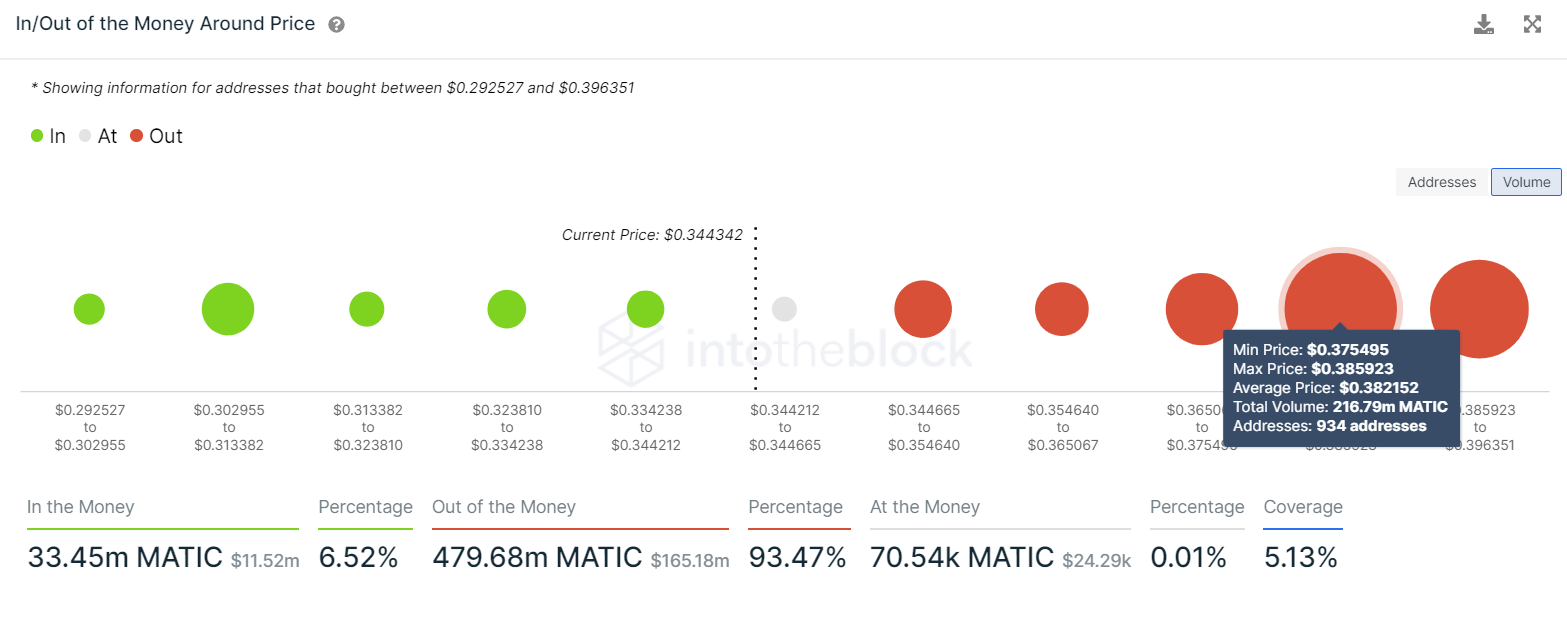
MATIC IOMAP Chart
While the breakdown seems likely, a bounce from the 100 six-hour SMA could deter the downtrend. A sudden spike in buying pressure that leads to a decisive 6-hour candlestick close above $0.36 will confirm the start of a reversal.
However, only after creating a higher high above $0.43 will add any credibility to the uptrend. In this case, the MATIC price could surge 23% to $0.54.
Author

Akash Girimath
FXStreet
Akash Girimath is a Mechanical Engineer interested in the chaos of the financial markets. Trying to make sense of this convoluted yet fascinating space, he switched his engineering job to become a crypto reporter and analyst.



